Trends in the Eurozone's Trade Surplus in 2025: Growth, Changes, and Important Partners

- Mar 03, 2026
Trends in the Eurozone's Trade Surplus in 2025: Growth, Changes, and Important Partners
Europe’s trade story in 2025 was not about a booming surplus so much as a managed surplus under pressure: exports rose, imports rose slightly faster, and the overall goods balance ended the year positive—but narrower than 2024.
That nuance matters. As per Europe Import Data by Import Globals, a trade surplus can look like a simple win, yet underneath it can hide structural shifts: weaker external demand in some markets, tougher pricing power in high-value manufactured exports, a changing energy bill, and intensifying competition from Asia. By the time the year closed, the euro area still posted a sizeable annual surplus, but the mix of where Europe was winning—and where it was losing—had shifted.
This blog breaks down the euro area’s 2025 goods surplus in clear numbers, explains what changed versus 2024, and highlights the partner and product trends that shaped the final result—along with what early 2026 signals suggest for the year ahead.
1) The 2025 Snapshot: The Surplus Stayed Strong but Got Smaller
Eurostat’s year-end release for trade in goods shows the euro area’s annual position plainly:
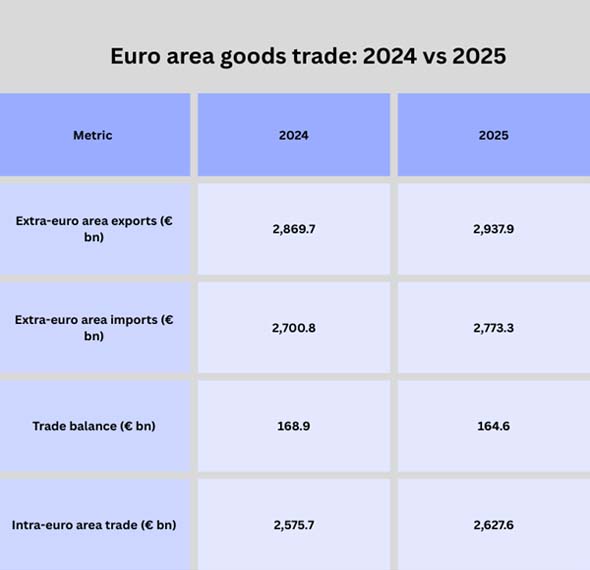
- Euro area goods trade surplus (Jan–Dec 2025): €164.6 billion
- Euro area exports (extra-euro area): €2,937.9 billion (+2.4% YoY)
- Euro area imports (extra-euro area): €2,773.3 billion (+2.7% YoY)
- Intra-euro area trade: €2,627.6 billion (+2.0% YoY)
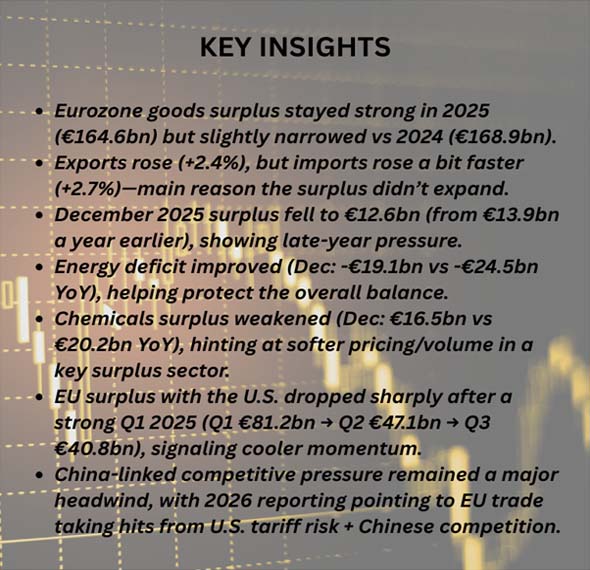
As per Europe Import Export Trade Data by Import Globals, compared with 2024, the surplus edged down (from €168.9 billion to €164.6 billion). The “why” is also clear in the growth rates: imports grew slightly faster than exports across the year.
2) How 2025 Ended: A December Surplus with Clear Signals from Each Sector
The year’s final month reinforced the “surplus under pressure” story:
- December 2025 euro area goods surplus: €12.6 billion
- Exports: €234.0 billion (+3.4% YoY)
- Imports: €221.3 billion (+4.2% YoY)
As per Europe Import Export Trade Data by Import Globals, imports accelerated faster than exports in December, which is consistent with the annual pattern. But the sector breakdown is the real clue: manufacturing surpluses softened, while the energy deficit improved.
3) What Caused the 2025 Surplus: Not One Thing, but a Mix of Things
A) Energy Remained a Deficit, but Became “Less Painful”
Europe’s energy import dependence typically pulls the trade balance down. In 2025, the energy deficit still existed, but the year-end data showed meaningful improvement in the deficit compared with the prior year’s late-2024 level (as seen in the December comparison).
This matters because a smaller energy deficit can “protect” the overall surplus even if manufacturing surpluses soften. In simple terms: As per Europe Import Custom Data by Import Globals, Europe didn’t need manufactured exports to grow explosively; it needed the energy bill not to spike—and the late-year numbers show that improvement supported the balance.
B) Exports Grew, but in a More Competitive World
Annual extra-euro area exports rose 2.4%, showing that global demand didn’t collapse for euro area goods.
But multiple signals suggest exporters faced tougher conditions: declines in some high-value categories and increased pressure from Chinese technology-heavy imports were cited in contemporaneous reporting based on official trade data. So the euro area’s export growth in 2025 looks more like “steady persistence” than a breakout.
C) Imports Rose Slightly Faster Than Exports
Imports grew 2.7% versus export growth of 2.4% for the year. As per Europe Import Trade Analysis by Import Globals, that doesn’t mean a demand boom; it can also reflect the euro area’s ongoing need for imported inputs and consumer goods, plus the changing composition of supply chains (including greater inflows of advanced manufactured items from outside the bloc).
4) Product Mix: Where the Balance Got Tighter
One of the simplest ways to understand 2025 is to treat the euro area trade balance like a portfolio:
- Manufactured exports are typically the “return engine”
- Energy imports are typically the “risk factor”
- Chemicals are often a crucial margin contributor
As per Europe Exporter Data by Import Globals, the December comparison reveals that chemicals’ surplus narrowed notably year-on-year (from €20.2 bn to €16.5 bn in that month’s comparison), a sign that either volumes, pricing, or both were weaker than the previous year.
Meanwhile, the energy deficit eased (from -€24.5 bn to -€19.1 bn in the December comparison), helping stabilize the overall balance.
Taken together, this suggests a 2025 pattern where the euro area’s surplus depended more on controlling import costs (especially energy) and less on accelerating manufacturing surpluses.
5) Important Partners: The U.S. Stayed Important, China The Biggest Gap Stayed
When we talk “Eurozone trade partners,” the two relationships that dominate headlines are:
- United States (typically a major destination for exports and a source of surplus)
- China (typically a major source of imports and a persistent deficit)
- As per Europe Importer Data by Import Globals, an analysis of EU-U.S. trade dynamics across 2025 highlights that the surplus with the U.S. shrunk across the year, and that Q1 was unusually strong as exporters moved early in anticipation of tariff risk—followed by weaker quarters.
- Even though this is EU-wide reporting, the direction is important for the euro area because the U.S. is a central export market and a key driver of Europe’s high-value manufacturing exports.
- On China, reporting based on official data described a widening deficit amid rising imports of advanced Chinese technology and intensifying competitive pressure.
- The U.S. surplus got weaker after a very good start in the partner tale of 2025.
- The China deficit stayed structurally big and easy to squeeze.
6) The "Shifts" in 2025: Not Just the Numbers, But Also the Path We're Taking
Shift 1: Surplus defense took the role of surplus expansion
The euro area had a big yearly surplus of €164.6 billion by the end of 2025, but it was a little less than in 2024. As per Europe Import Shipment Data by Import Globals, that indicates a year where Europe’s goal was effectively “protect the surplus,” not “grow the surplus.”
Shift 2: The late-year sector mix favored energy relief over chemicals strength
Late-year numbers show energy deficits improving and chemicals surplus shrinking in the year-on-year comparison. That is a meaningful change from the classic European surplus model where chemicals and high-end manufacturing do the heavy lifting.
Shift 3: Trade friction risks increasingly shaped timing and flows
Eurostat’s EU–U.S. notes emphasize how tariff expectations can shift trade patterns within the year (front-loading, then cooling).
In other words, 2025 trade wasn’t just about demand—it was also about policy risk management.
7) The Beginning of 2026: What the Data Says About the Next Cycle
While this blog focuses on 2025, “latest information 2025–2026” requires looking at what early 2026 commentary is saying about the direction of travel.
Two big signals stand out:
Tariff Pressure and External Competitiveness Risks
As per Europe Import Export Trade Analysis by Import Globals, recent reporting based on trade data pointed to a shrinking surplus and cited weaker exports to the U.S. alongside rising competitive pressure from Chinese imports.
Macro Effects: Trade Shocks Can Feed Into Growth and Inflation Channels
ECB economists have discussed how tariff-driven demand hits can weigh on euro area exports, with knock-on effects that can influence inflation and growth dynamics (and potentially interact with monetary policy decisions).
So if you’re projecting euro area trade for 2026, the biggest “watch items” are:
- U.S.-linked demand and policy conditions
- China-linked import competition and deficit dynamics
- The energy bill trajectory
- Whether manufacturing surpluses regain momentum or remain pressured
Conclusion
As per Europe Export Import Global Trade Data by Import Globals, the euro area’s 2025 trade surplus remained substantial—but it was not a simple victory lap. The annual goods surplus finished at €164.6 billion, slightly down from 2024, with exports up 2.4% and imports up 2.7%.
Under the surface, the balance reflected an evolving mix:
- Energy deficits improved, helping stabilize the overall balance late in the year,
- Chemicals surpluses softened in late-year comparisons,
- The U.S. remained a crucial surplus partner, but the surplus trajectory weakened through 2025 quarters,
- The China deficit stayed structurally heavy, with competition pressures frequently cited in analysis of official data.
If 2024 looked like a recovery year for Europe’s external balance, 2025 looked more like a year of resilience under tightening conditions. The euro area kept the surplus—yet the shifts in products and partners suggest the next phase will depend less on “one big engine” and more on how well Europe navigates trade friction, competitiveness, and the evolving global demand map. Import Globals is a leading data provider of Europe Import Export Trade Data.
FAQs
Que. What was the euro area’s trade surplus in 2025?
Ans. The euro area recorded a €164.6 billion goods trade surplus in January–December 2025.
Que. Did the euro area surplus grow in 2025?
Ans. No. It narrowed slightly versus 2024 (from €168.9 bn to €164.6 bn), because imports rose a bit faster than exports.
Que. Which sectors mattered most to the year-end balance?
Ans. Data from late in the year shows that the chemicals surplus is lower and the energy deficit is better, both of which affected the overall balance.
Que. Who had the largest impact on Europe's commerce in 2025?
Ans. The United States remained a key partner with a surplus, even though the surplus declined during the course of 2025. China, on the other hand, was still tied to a large deficit and mounting competitive pressures.
Que. Where to get detailed Europe Import Export Global Data?
Ans. Visit www.importglobals.com.