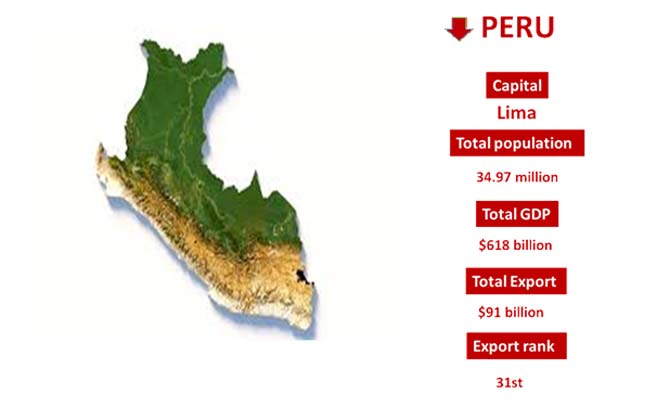
The industrial productivity rate has been promoting the diversity of different regions' export rankings worldwide. Researchers right now are supposed to take a proper update of the growing economic regions to update their database. Peru, based in western South America, sharing borders with Brazil and Bolivia to the east and southeast, has now been emerging as the top export authority of the global trade market. Peru Export Data represented the participation of the country in the Pacific Alliance and the proper expansion of South trade partnerships as the main factors enhancing global trade stability.
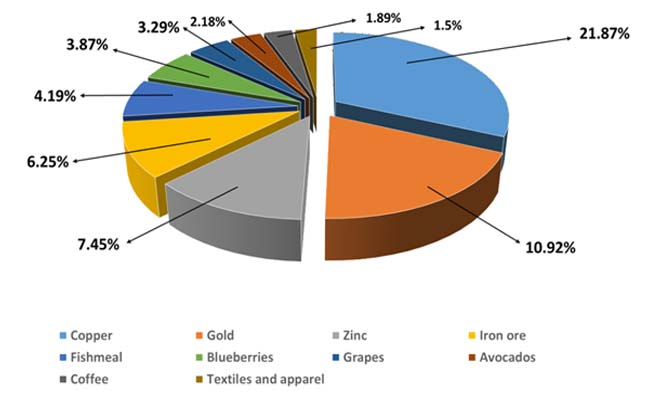
The agro-export sector is getting diversified with time, mainly due to blueberries, avocados, and other industrial essentials' strong global demand rate. Peru Export Trade Statistics listed the country's export ranking as 31st on a global scale, with a total valuation of exports worth $91 billion in 2025.