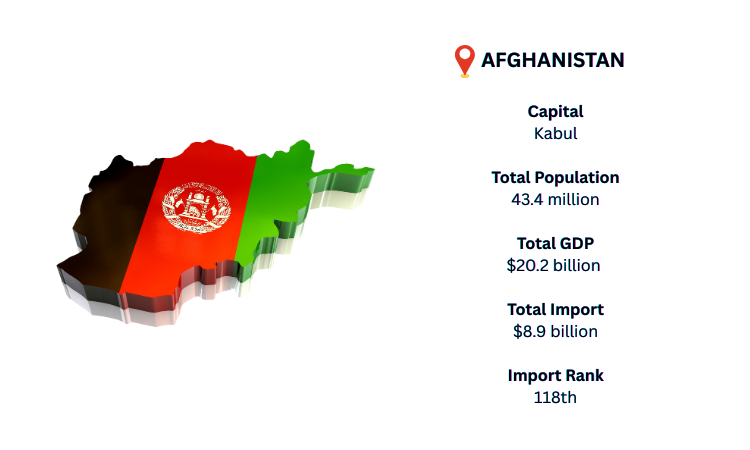
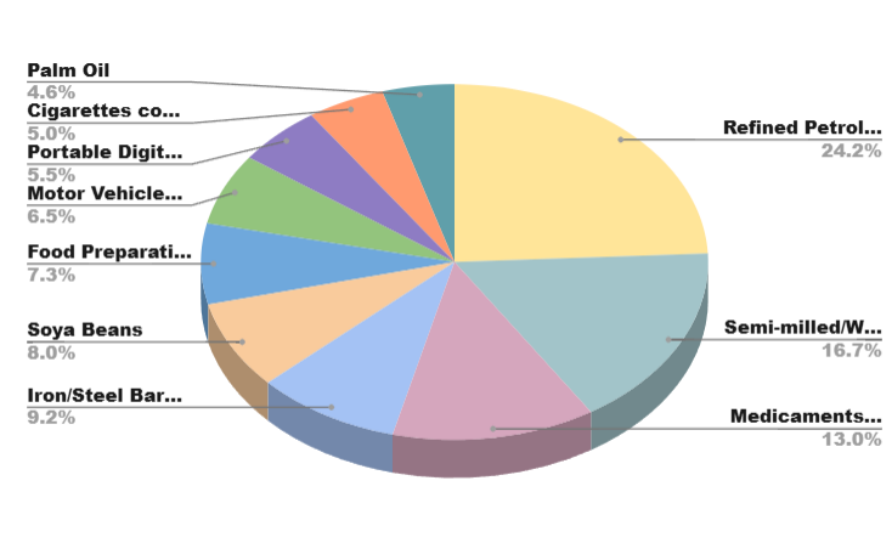
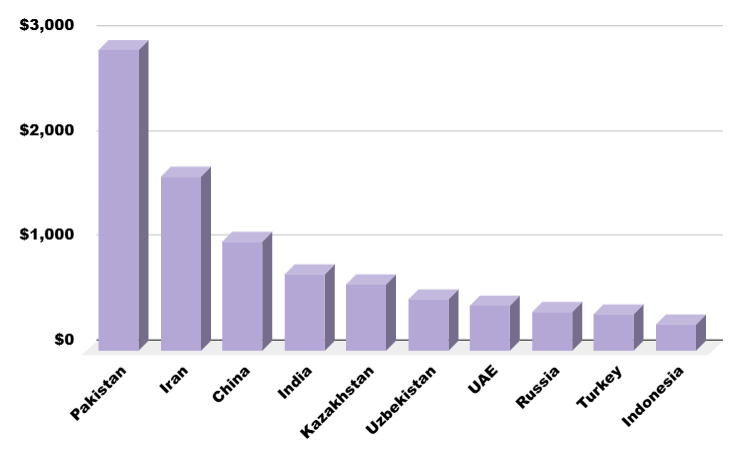
Afghanistan Import Data

Afghanistan Import Data

The economic life of Afghanistan depends on its international trade. The country was the number 140 economy in the world in terms of total imports.

As per Afghanistan Import Data, the main imports of the country in 2021 were wheat flours, rolled tobacco, palm oil, electricity and raw sugar.

The value of goods imported by Afghanistan in 2021 was USD 5.5 billion. The main import partners of the country are Pakistan, Russia, Uzbekistan, Iran and China.

Our Afghanistan Import Customs Data is based on the customs shipping bill documents, Bill of entries which provide the most authenticate and accurate information. Imports Globals Afghanistan Import Shipments Data helps the importers to identify the global suppliers of the particular product which they want to import along with its price, quantity and all other required details.

Afghanistan Customs Global Trade data – Exclusive Information includes

Import Globals provides the most authentic, real-time and comprehensive Afghanistan Import Customs Trade Data report that accurately provides a larger picture of figures and facts about the importing scenario of Afghanistan.

What Information Contain In Afghanistan Customs Data


Name of Importers

Name of Importers

List of companies who purchased the goods.
Address of Importers

Address of Importers

Address of importing company with details of location where goods arrived.
Name of the Exporters

Name of the Exporters

List of exporters with names.
Address of the Exporters

Address of the Exporters

Address of exporting company with details of location.
Hs Code

Hs Code

Harmonized Commodity Description and Coding System (HS Code) of tariff nomenclature is a international standardized system of names and numbers.
Product Description

Product Description

Detailed description of product of particular HS code as per recorded shipping or invoice bill.
Quantity

Quantity

Quantity of materials exported in different units.
Destination Country

Destination Country

Country where the product is exported.
Country of Origin

Country of Origin

Country of manufacture, production or growth where the product is exported from.
Date of Shipment

Date of Shipment

Shipment date as on the date of filling shipment/bill of lading at the time of custom clearance.

Afghanistan Import Customs Trade Data Shows Top 10 Importing Products In 2021 – Analysis By Chapter

  • 22% - Mineral Fuels, Mineral oils and products of their distillation, bituminous substances, mineral waxes with a value of US$ 1.94 billion
  • 6.91% - Products of Milling industry, malt, starches, insulin, wheat gluten with a value of US$ 592 million
  • 5.31% - Animal fats, vegetable or microbial fats, animal or vegetable waxes with a value of US$ 455 million
  • 5.12% - Electrical machinery and equipment, sound recorders, and reproducers, television image, and parts thereof with a value of US$ 438 million
  • 4.56% - Articles of stone, plaster, cement, asbestos, mica or similar materials with a value of US$ 390 million
  • 4.53% - Vehicles other than railway or tramway rolling stock, and parts and accessories thereof with a value of US$ 388 million
  • 4.18% - Other vegetable textile fibers, paper yarn and woven fabric of paper yarn with a value of US$ 358 million
  • 4.18% - Optical, photographic, cinematographic, measuring and apparatus, parts and accessories thereof with a value of US$ 358 million
  • 3.62% - Commodities not specified according to kind with a value of US$ 310 million
  • 2.85% - Iron and steel with a value of US$ 245 million

Afghanistan Import Global Trade Data Shows Top 10
Trading Partners
of Afghanistan

  • Iran with a share of 14.5% (1.24 billion US$)
  • China with a share of 13.9% (1.19 billion US$)
  • Pakistan with a share of 12.8% (1.1 billion US$)
  • USA with a share of 9.14% (783 million US$)
  • Turkmenistan with a share of 8.05% (690 million US$)
  • Kazakhstan with a share of 6.09% (522 million US$)
  • India with a share of 5.29% (453 million US$)
  • Uzbekistan with a share of 5.05% (433 million US$)
  • Malaysia with a share of 3.74% (320 million US$)
  • Turkey with a share of 3.39% (291 million US$)

Afghanistan Import Data Sample

Our Services

Import

We Import Globals provides you a platform to reach direct suppliers & buyers of your product. You can check by using our Afghanistan import trade statistics data out all trade activities between Afghanistan and other countries. We have recorded more than 80 million of shipment records from over 8 million businesses in 18 countries.

We have established top leading name in the market by serving more than 5000 clients and they are highly satisfied with our services.

Use right way to grow your business by using Import Globals Afghanistan customs data Our expert team will be happy to provide you solution on your business through Global trade database. 


You may also be interested in data of other Asia Import Export countries

Ask for Afghanistan Import Sample Data and Demo

TOP