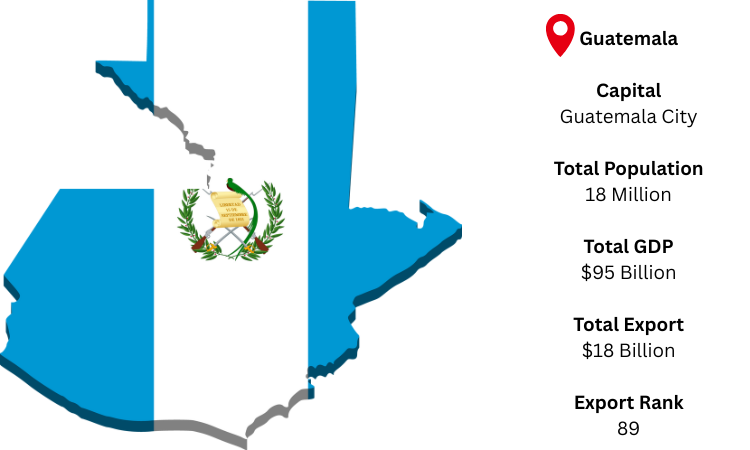
Guatemala Export Data

Guatemala Export Data

As per Guatemala export data Guatemala is considered as a developing economy and it is highly dependent on its traditional agriculture crops such as Coffee, Sugar and Bananas. The traditional export of goods represents a large share to the market. As per Guatemala export trade data the economy of Guatemala is dominated by the private sector which generates GDP of about 85% as per recorded figures.

As per Guatemala export customs data shows top ranked Exporting products from Guatemala are its Traditional Agricultural product it includes – Coffee, Tea, Sugar, Spices  etc. Second top Exporting products are Edible Fruits and Nuts. Textiles & Knitted Apparel are top third export from Guatemala.

According to Guatemala export statistics data united States is top leading trading partner of Guatemala with a share of 32%. Second top trading partner is El Salvador with a share of 11.2% and Honduras with a share of 8.73 is third top trading partner of Guatemala.

As according to Guatemala export trade statistics data the value of merchandise exports from Guatemala totaled $ 11.6 billion in 2020. Merchandise exports from Guatemala increased by 3.27% compared to 2019. Goods exports grew up by $ 369 million in 2020 the value of merchandise exports from Guatemala amounted to $11.2 billion in 2019.

Guatemala Export Customs Trade Data Shows Top 10 Importing Products In 2020 – Analysis By Chapter

  • 15.4% for Chapter 09 – Coffee, tea, matT and spices value of 1.79 billion US$
  • 11.2% for Chapter 08 – Edible fruit and nuts; peel of citrus fruit or melons value of 1.3 billion US$
  • 9.11% for Chapter 61 – Articles of apparel and clothing accessories, knitted or crocheted value of 1.06 billion US$
  • 6.11% for Chapter 17 – Sugars and sugar confectionery value of 712 million US$
  • 4.96% for Chapter 15 – Animal or vegetable fats and oils and their cleavage products prepared edible fats; animal or vegetable waxes value of 578 million US$
  • 3.92% for Chapter 72 – Iron and steel value of 457 million US$
  • 3.19% for Chapter 07 – Edible vegetables and certain roots and tubers
  • 3.15% for Chapter 39 – Plastics and articles thereof value of 367 million US$
  • 2.93% for Chapter 48 – Paper and paperboard; articles of paper pulp, of paper or of paperboard value of 341 million US$
  • 2.45% for Chapter 22 – Beverages, spirits and vinegar value of 286 million US$

Guatemala Export Global Trade Data Shows Top 10
Trading Partners
of Guatemala

  • USA with a share of 32% (3.76 billion US$)
  • El Salvador with a share of 11.2% (1.31 billion US$)
  • Honduras with a share of 8.73% (1.01 billion US$)
  • Nicaragua with a share of 5.68% (662 million US$)
  • Mexico with a share of 3.96% (462 million US$)
  • Costa Rica with a share of 3.81% (445 million US$)
  • Netherlands with a share of 3% (350 million US$)
  • Saudi Arabia with a share of 2.73% (318 million US$)
  • United Arab Emirates with a share of 2.04% (238 million US$)
  • China with a share of 1.95% (227 million US$)

Guatemala Export Data Sample

Our Services

Export

We Import Globals provides you a platform to reach direct suppliers & buyers of your product. You can check by using our Guatemala export trade statistics data out all trade activities between Guatemala and other countries. We have recorded more than 80 million of shipment records from over 8 million businesses in 18 countries.

We have established top leading name in the market by serving more than 5000 clients and they are highly satisfied with our services.

Use right way to grow your business by using Import Globals Guatemala customs data

Our Expert team will be happy to provide you solution on your business through Global trade data.

FIND OUT OTHER NORTH AMERICA TRADE DATA COUNTRIES IMPORT EXPORT DATA

Ask for Guatemala Export Sample Data and Demo

TOP