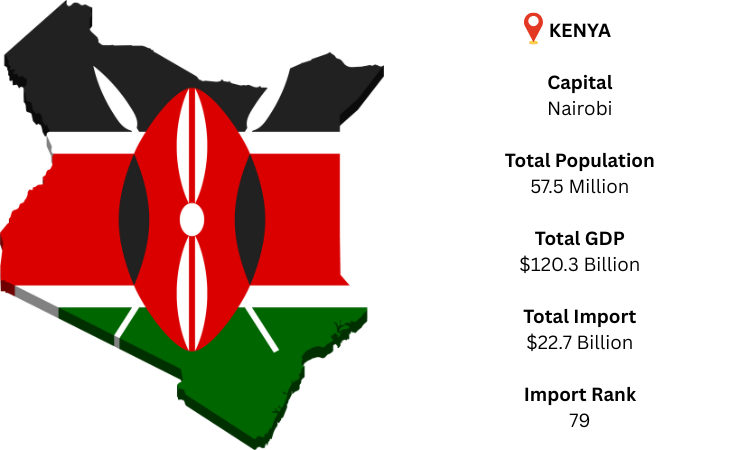
Tanzania, Uganda, South Sudan, Ethiopia, and Somalia are the countries that border Kenya, an East African nation that is situated near the Indian Ocean. Kenya's main city and capital, Nairobi, acts as the commercial and economic hub of the country. As per the KENYA import data, Kenya's GDP, which is fueled by commerce, agriculture, and services, is projected to reach USD 120.3 billion in 2024.
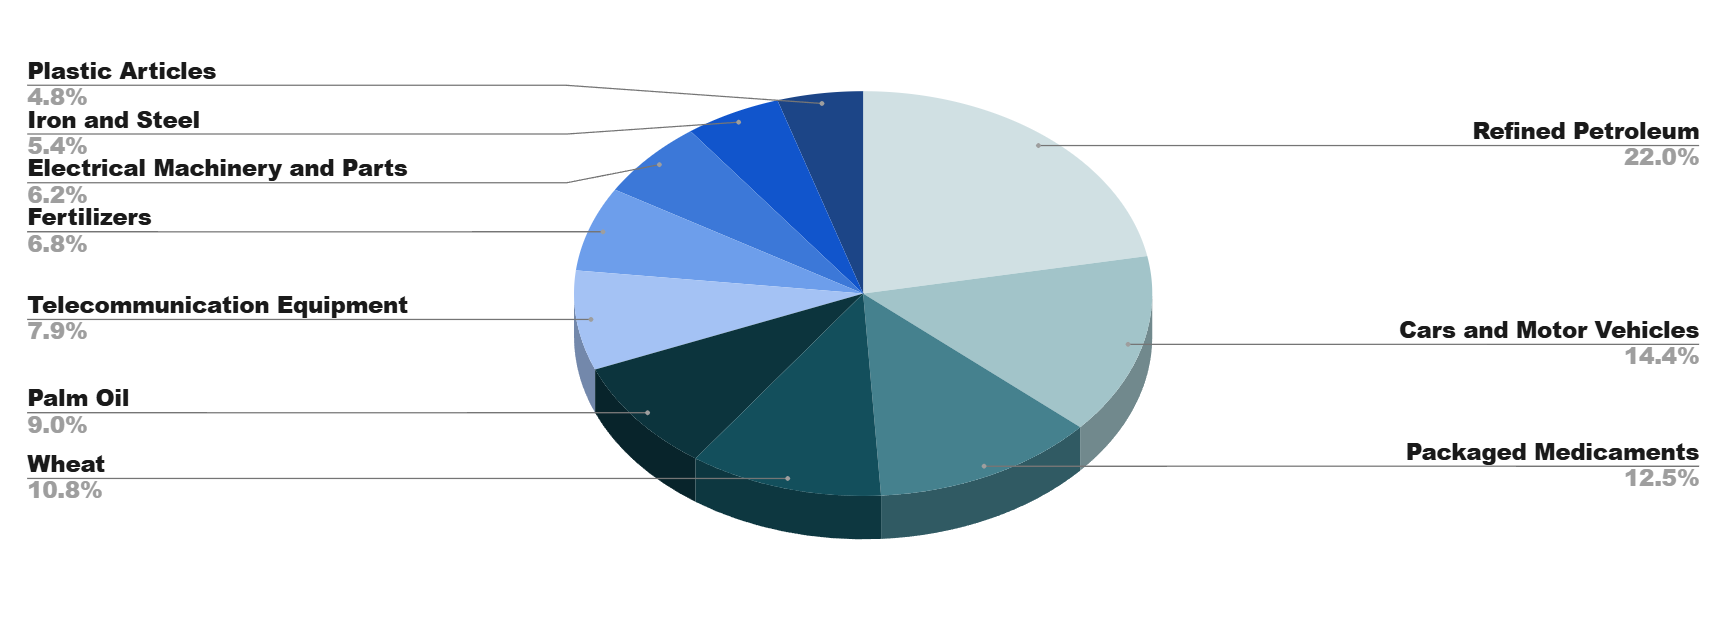
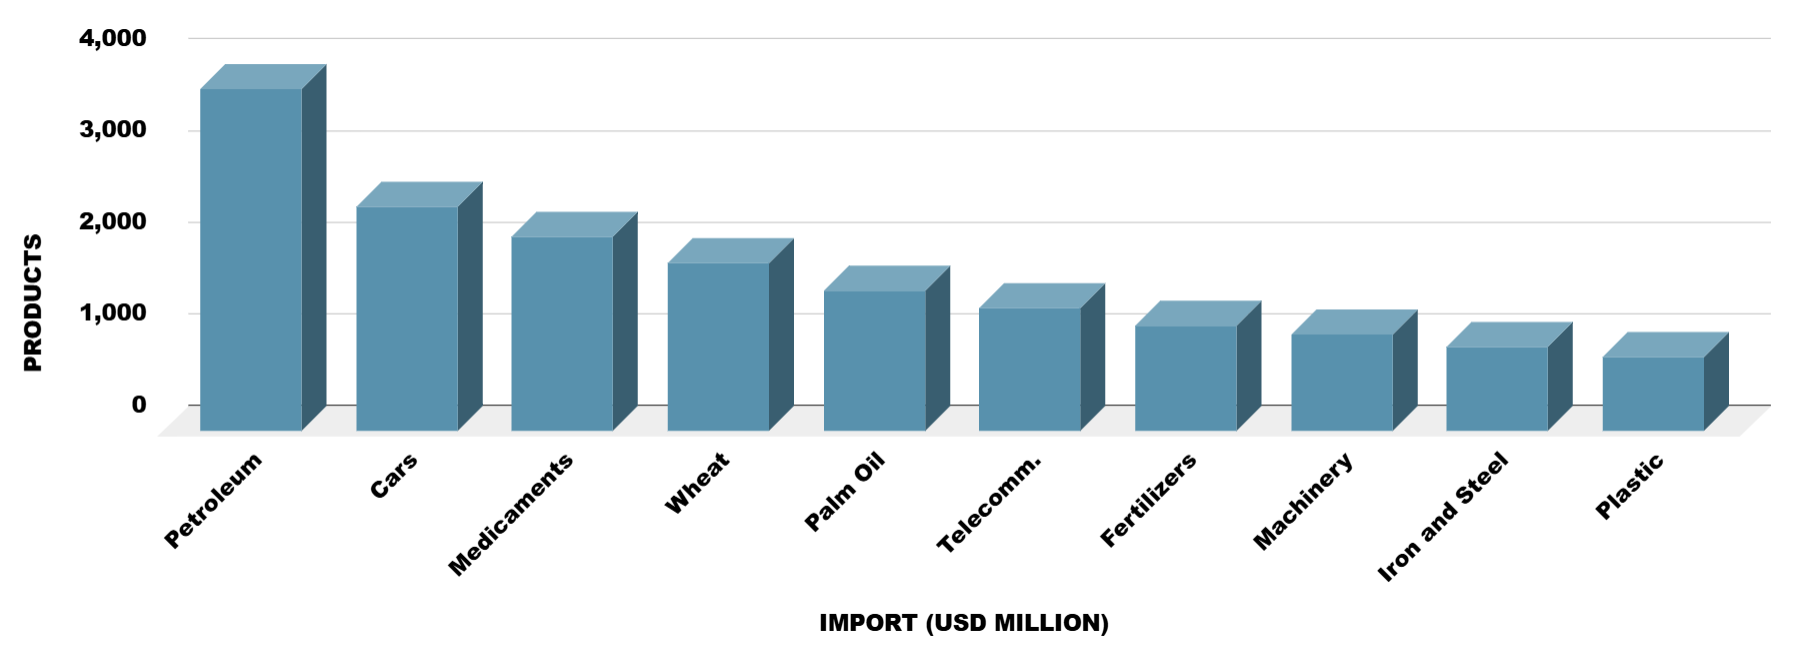
Kenya is the 79th-largest importer in the world, based on recent global import rankings. Kenya's top export destination is China. It is estimated that Kenya would import around USD 22.7 billion in total in 2024, with refined petroleum ranking as the most popular import.
Kenya's advantageous coastline position and sophisticated port infrastructure, particularly the Port of Mombasa, make it a major player in East African trade. As per the KENYA customs data, for landlocked nations like South Sudan, Rwanda, and Uganda, it serves as an essential entry point. Its international import connections have been further reinforced by growing investments in trade agreements and transportation.