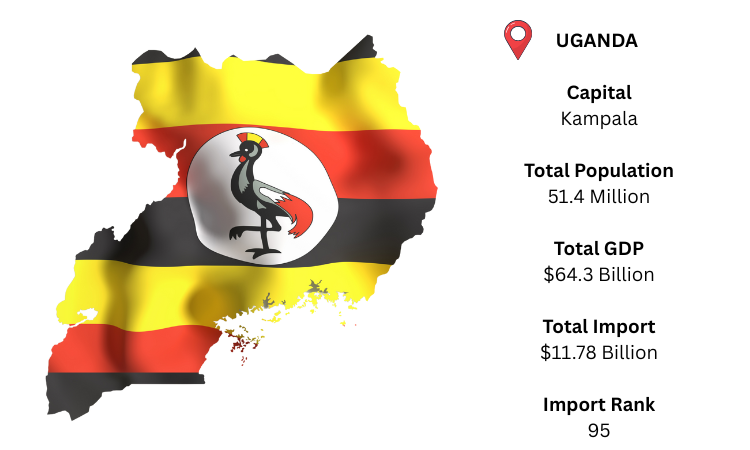
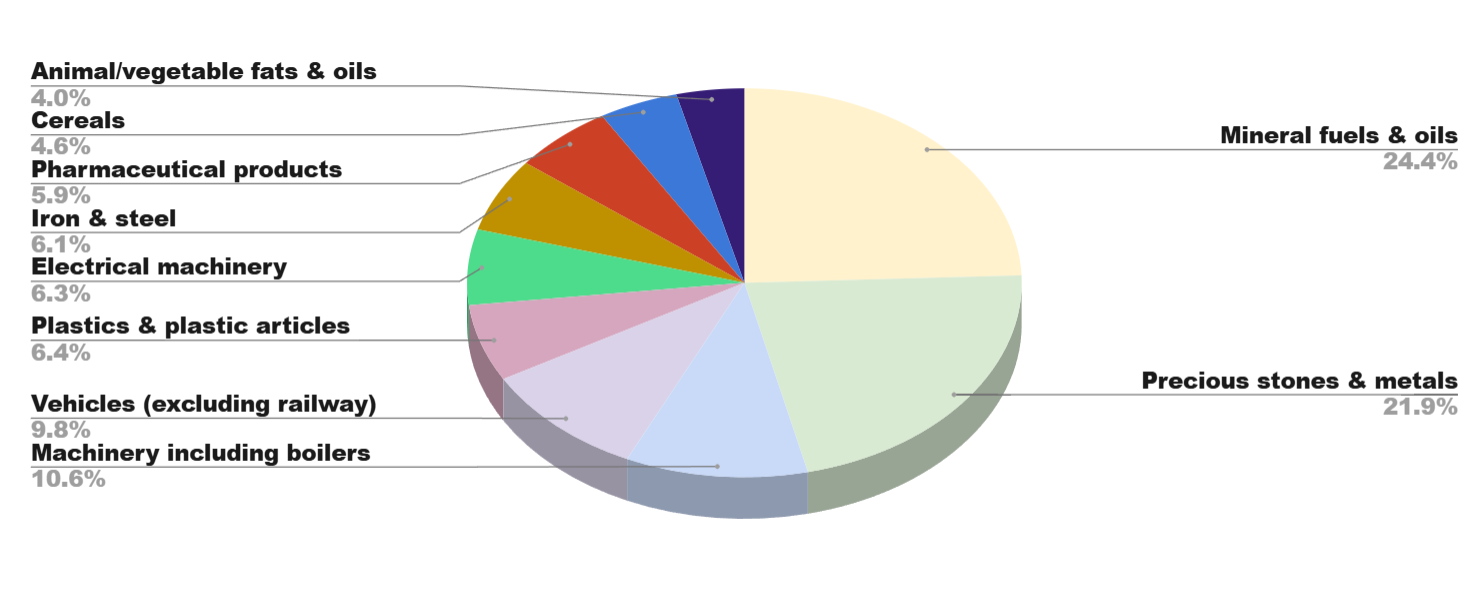
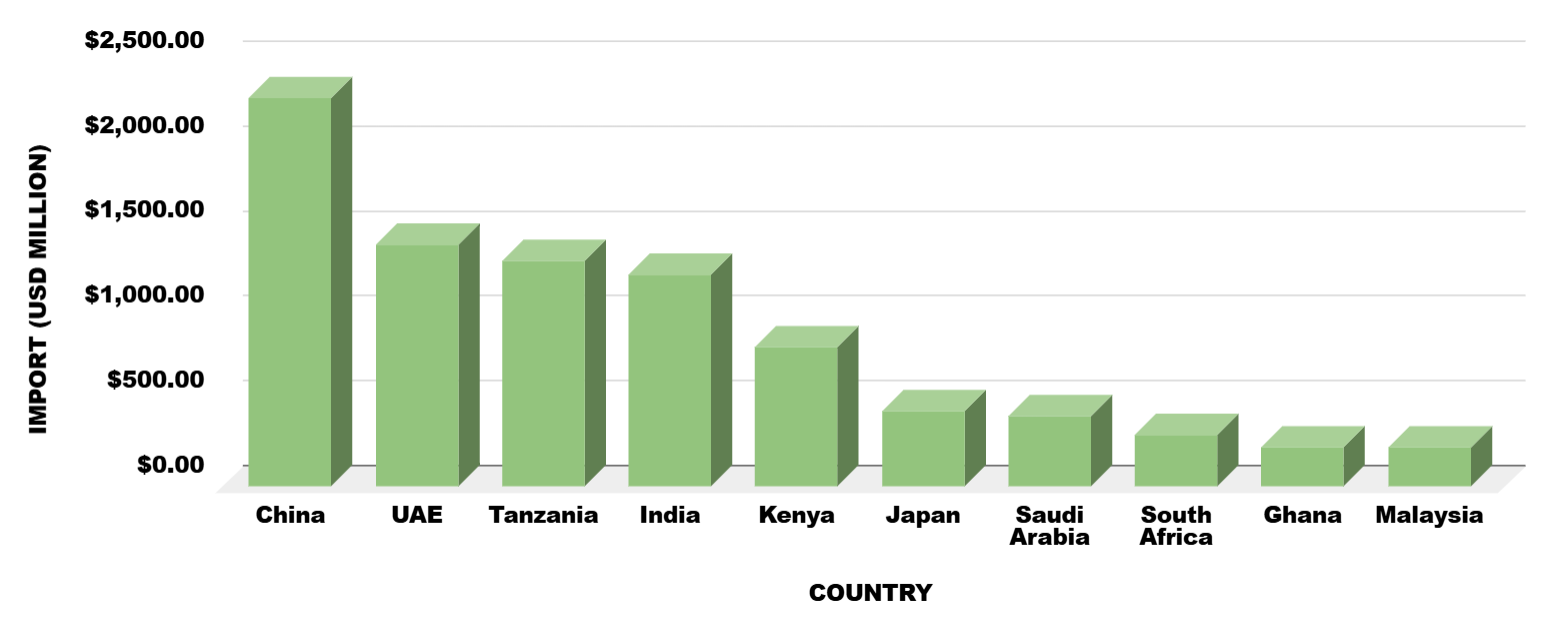
Uganda Import Data

Uganda Import Data

As per Uganda import data the economy of Uganda has great potential and appeared dignified for rapid economic growth and development.  Uganda is capable with significant natural resources, including ample fertile land, regular rainfall, and mineral deposits.

As per Uganda import trade data since 1990’s the economy of Uganda has been grown rapidly. During the period of 1990- 2015 real gross domestic product (GDP) grew at an average of 6.7% annually whereas real GDP per capita grew at 3.3% per annum during in the same period.

The moderate climate of Uganda is especially affable to the production of both livestock and crops.

Uganda import customs data shows agricultural products supply a significant portion of Uganda’s foreign exchange earnings, with coffee alone, of which Uganda is Africa’s second largest producer after Ethiopia.

Uganda import shipment data shows the value of merchandise imports to Uganda totalled $ 8.25 billion in 2020. As according to Uganda import trade statistics data the value of merchandise imports to Uganda was equal to $ in 2019.

What Information Contain In Uganda Customs Data


Name of Importers

Name of Importers

List of companies who purchased the goods.
Address of Importers

Address of Importers

Address of importing company with details of location where goods arrived.
Name of the Exporters

Name of the Exporters

List of exporters with names.
Address of the Exporters

Address of the Exporters

Address of exporting company with details of location.
Hs Code

Hs Code

Harmonized Commodity Description and Coding System (HS Code) of tariff nomenclature is a international standardized system of names and numbers.
Product Description

Product Description

Detailed description of product of particular HS code as per recorded shipping or invoice bill.
Quantity

Quantity

Quantity of materials exported in different units.
Destination Country

Destination Country

Country where the product is exported.
Country of Origin

Country of Origin

Country of manufacture, production or growth where the product is exported from.
Date of Shipment

Date of Shipment

Shipment date as on the date of filling shipment/bill of lading at the time of custom clearance.

Uganda Import Customs Trade Data Shows Top 10 Importing Products In 2020 – Analysis By Chapter

  • 22% for Chapter 71 – Natural or cultured pearls, precious or semi-precious stones, precious metals, metals clad with precious metal and articles thereof; imitation jewelry; coin value of 1.84 billion US$
  • 11.8% for Chapter 27 – Mineral fuels, mineral oils and products of their distillation; bituminous substances; mineral waxes value of 976 million US$
  • 7.23% for Chapter 84 – Nuclear reactors, boilers, machinery and mechanical appliances; parts thereof value of 597 million US$
  • 6.71% for Chapter 87 – Vehicles other than railway or tramway rolling stock, and parts and accessories thereof value of 553 million US$
  • 4.87% for Chapter 85 – Electrical machinery and equipment and parts thereof; sound recorders and reproducers, television image and sound recorders and reproducers, and parts and accessories of such articles value of 402 million US$
  • 4.67% for Chapter 39 – Plastics and articles thereof value of 385 million US$
  • 4.36% for Chapter 72 – Iron and steel value of 360 million US$
  • 4.25% for Chapter 30 – Pharmaceutical products value of 351 million US$
  • 3.51% for Chapter 15 – Animal or vegetable fats and oils and their cleavage products prepared edible fats; animal or vegetable waxes value of 289 million US$
  • 3.2% for Chapter 10 – Cereals value of 264 million US$

Uganda Import Global Trade Data Shows Top 10
Trading Partners
of Uganda

  • China with a share of 16.3% (1.35 billion US$)
  • India with a share of 11.6% (959 million US$)
  • Kenya with a share of 9.37% (773 million US$)
  • Tanzania with a share of 9.01% (743 million US$)
  • United Arab Emirates with a share of 6.01% (495 million US$)
  • Japan with a share of 4.15% (342 million US$)
  • Saudi Arabia with a share of 3.32% (274 million US$)
  • South Africa with a share of 2.67% (220 million US$)
  • Gambia with a share of 2.58% (212 million US$)
  • Zimbabwe with a share of 2.47% (203 million US$)

Uganda Import Data Sample

Benefits Of Uganda Import Data

1. FIND ACTIVE/LIVE BUYERS & SUPPLIERS: Uganda import data is based on actual shipping bill documents. You will get active importers & exporters of your product with Uganda import trade data. This is Uganda import customs data it gives you result of most recent shipments globally.
2. FIND MORE LEADS: Uganda import database allows you to gain insights in a relatively short amount of time, while your team can spend time on other things. You can directly reach to Buyers/Suppliers of your product and generate leads easily with the help of Uganda import shipment data.
3. TRACK YOUR COMPETITIORS: It is vitally important to know who your competitor is and how they are performing. With the help of Uganda import trade statistics data you can track your competitor shipments. To succeed in your respected industry, you need to understand who you’re up against. With the help of Uganda import customs statistics data you can keep ‘eye wide open’ on each and every activity of your competitor.
4. EMERGING MARKET TREND: If you treat your market research as an ongoing exercise that you do periodically, you’ll find that you’ll have a lot of database to be able to analyses your customers and establish any particular trends. Uganda import customs trade data are using by all Large, Medium & Small companies for more efficient Market analysis.
5. MINIMIZE ANY INVESTMENT RISK: For any business, it is very important to reduce any risk and minimize investment where possible to maximize their profit.  By using Uganda import data you can find easily which leads convert at a higher rate for a lower cost and you can cut out unnecessary spending.
6. KNOW YOUR CURRENT & POTENTIAL CLIENT: You will have all the details about your current and potential clients through Uganda import trade database. Uganda import customs data works as a fuel to your business and its success on many levels. These are the people who purchase and repurchase your product or service and are also the people who are recommending it to other potential future customers.
7. UNDERSTAND YOUR COMPETITION: A businesses competition can easily overtake them if they aren’t careful and do not pay attention to competitor’s actions. However, if the business were to monitor what their competition are doing they can make attempts to counter them more effectively. Through Uganda import statistics data you can understand the active competition & threats in the market.
8. CREATE YOUR BUSINESS PLANS: For a good market plan it is very necessary to do regular research and find out your target market through Uganda import data. A Business plan outlines what your overall objective is and should detail how you’re going to get there. Research is base for this plan and many companies benefited by Customs trade data which gives you real time analysis for your business plans.

Our Services

Import

We Import Globals provides you a platform to reach direct suppliers & buyers of your product. You can check by using our Uganda import trade statistics data out all trade activities between Uganda and other countries. We have recorded more than 80 million of shipment records from over 8 million businesses in 18 countries.

We have established top leading name in the market by serving more than 5000 clients and they are highly satisfied with our services.

Use right way to grow your business by using Import Globals Uganda customs data

Our Expert team will be happy to provide you solution on your business through Global trade data.

Ask for Uganda Import Sample Data and Demo

TOP