Australia, currently positioned in the southern hemisphere, lying across the southeast of Asia, is one of the top import economies of the global marketplace. Australia Import Data has listed the strong demand for advanced machinery and petroleum products as the factors contributing to the hike in Australia's import trade. The proper expansion of the trade infrastructure of Australia is mainly facilitated by government regulations and the low tariff barriers.
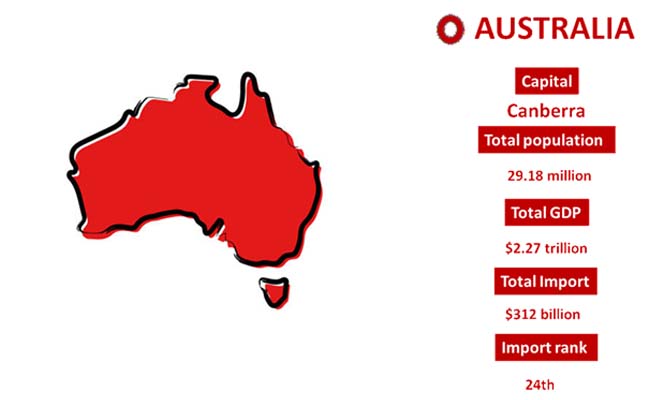
Australia Statistical Data has represented the global trade volatility and the geopolitical risks as the factors affecting the import stability of the country. Australia has stood up at a GDP value of 2.27 trillion US dollars in 2025. The country has respectively recorded a total valuation of 312 billion US dollars of imports in 2025, worth a global import ranking of 24th at present. The vast pharmaceutical production capacity and the diplomatic trade relations maintained by the country with the top suppliers have facilitated the import of specific essentials, such as technology imports. Let's have an in-depth trade overview of the import economy of Australia, with the latest import variants, shipment rates and the top trade partners.