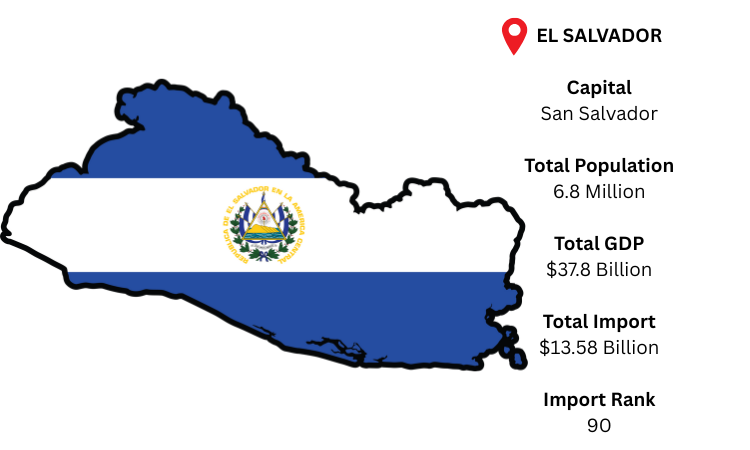
The economy of El Salvador, a growing Central American nation, is heavily dependent on imported consumer products, machinery, and petroleum. The capital, San Salvador, is the center of its government and business. As per El Salvador import data, with a GDP of about USD 37.8 billion (2025 estimated), and a population of about 6.8 million
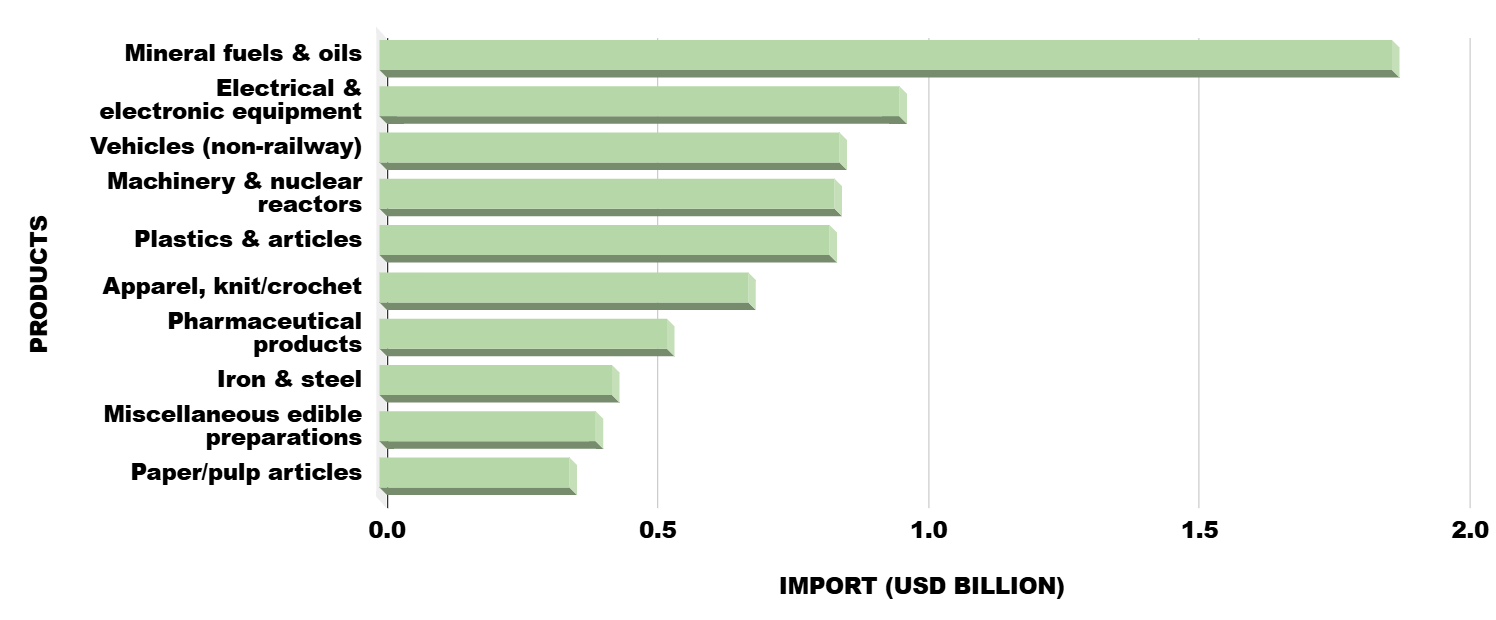
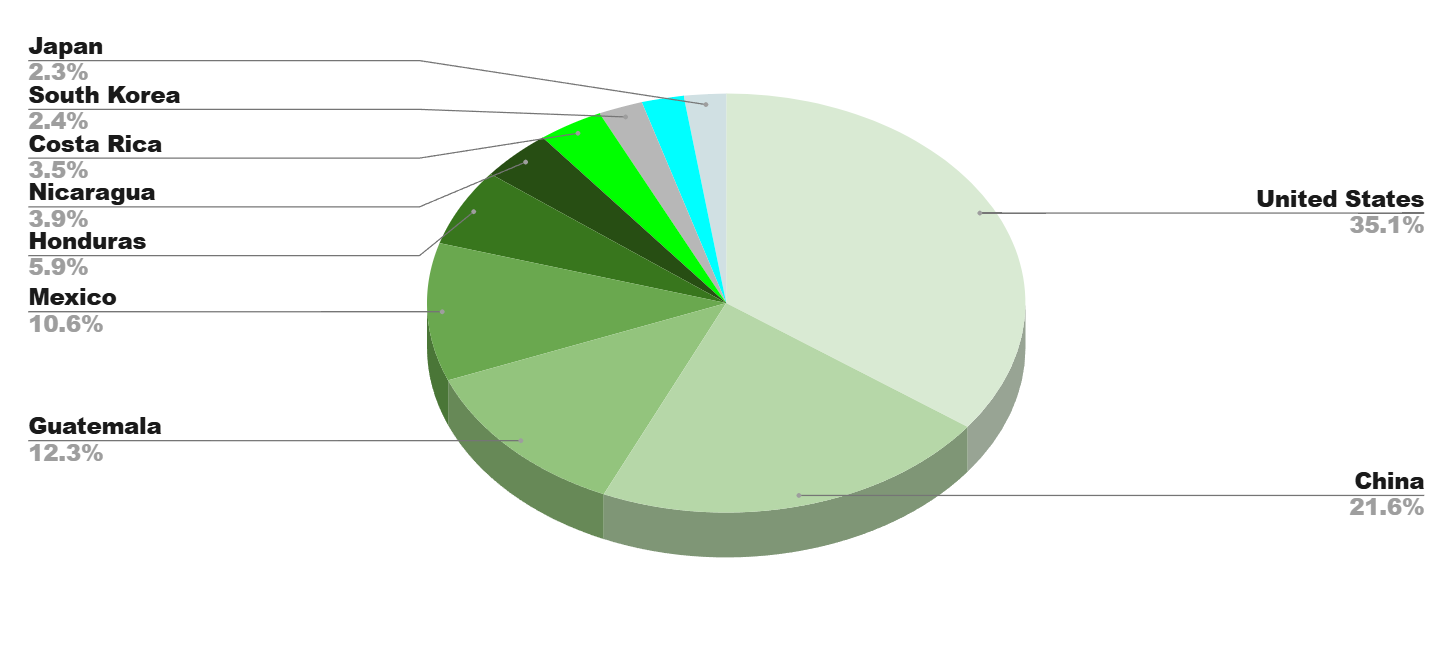
As per El Salvador customs data, El Salvador imported a total of USD 13.58 billion. The United States, China, and Guatemala are its biggest import partners, and the main product categories include autos, electrical equipment, and mineral fuels.