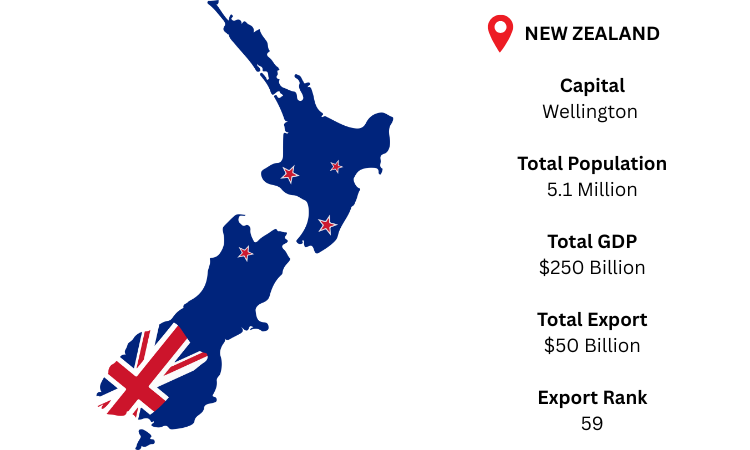
New Zealand Export Data

New Zealand Export Data

As per New Zealand export data, the country’s exports valued USD 11.35 billion in 2021. Exports of the country grew 9.6% from a year earlier to NZD 4396 million in September 2021.

As per New Zealand export trade data the value of merchandise exports from New Zealand totalled $ 38 billion in 2020. Overall commodity exports from New Zealand declined by 1.67% compared to 2019. Based on New Zealand export custom data merchandise exports reduced by $ 662 million the value of merchandise exports from New Zealand amounted to $ 39 billion in 2019.

According to New Zealand export statistics data, the top exports of New Zealand are Concentrated Milk, Sheep and Goat Meat, Rough Wood, Butter, and Frozen Bovine Meat, and the major exporting partners are China, Australia, United States, Japan, and South Korea.

Why Choose Our New Zealand Export Data

Our New Zealand shipment data is useful to every business type; start-ups to big corporates and every industry –Logistics and Market Researchers. Here is a short view about our Export data of New Zealand:

Data Available Till date

100% Coverage Trade Activity

Monthly Update Time

Sea, Air & Road Shipments Covered

100% Data Authenticity

Data Available on 2, 4, 6 & 8 digit Level HS Code

Historical Data Available Since 2010

Discover High Growth

Discover High Volume

New Zealand Export Custom Statistics Data Shows Top 10 Importing Products In 2020 – Analysis By Chapter

  • 27% for Chapter 04 - Dairy produce; birds eggs; natural honey; edible products of animal origin, not elsewhere specified or included value of 10.6 billion US$
  • 13.5% for Chapter 02 - Meat and edible meat offal value of 5.26 billion US$
  • 7.52% for Chapter 44 - Wood and articles of wood; wood charcoal value of 2.92 billion US$
  • 6.56% for Chapter 08 - Edible fruit and nuts; peel of citrus fruit or melons value of 2.55 billion US$
  • 4.16% for Chapter 19 - Preparations of cereals, flour, starch or milk; bakers' wares value of 1.61 billion US$
  • 3.85% for Chapter 22 - Beverages, spirits and vinegar value of 1.49 billion US$
  • 2.74% for Chapter 84 - Nuclear reactors, boilers, machinery and mechanical appliances; parts thereof value of 1.06 billion US$
  • 2.58% for Chapter 90 - Optical, photographic, cinematographic, measuring, checking, precision, medical or surgical instruments and apparatus; parts and accessories thereof value of 1 billion US$
  • 2.44% for Chapter 35 - Albuminoidal substances; modified starches; glues; enzymes value of 948 million US$
  • 2.38% for Chapter 99 - Commodities not specified according to kind value of 926 million US$

New Zealand Export Custom Trade Data Shows Top 10
Trading Partners
of New Zealand

  • China with a share of 27% (10.7 billion US$)
  • Australia with a share of 13.5% (5.28 billion US$)
  • USA with a share of 11% (4.29 billion US$)
  • Japan with a share of 5.94% (2.31 billion US$)
  • Korea with a share of 2.85% (1.11 billion US$)
  • United Kingdom with a share of 2.53% (986 million US$)
  • Other Asia, nes with a share of 2.19% (854 million US$)
  • Hong Kong with a share of 1.98% (772 million US$)
  • Singapore with a share of 1.82% (708 million US$)
  • Indonesia with a share of 1.79% (697 million US$)

What our New Zealand Export Data contains

New Zealand export statistics data is a kind of Statistical data used for primary research of the market.  New Zealand export trade statistics data is calculated on shipping bills, export bills, invoices, and other export documents. It contains Year, Month, HS Code, Product Description, Quantity, Destination Country & Values Information. It gives a bird’s eye view of the country’s export business.

Export

Ask for New Zealand Export Sample Data and Demo

TOP