The Republic of Korea, also popularly known as South Korea, based in East Asia, surrounded by North Korea and the Yellow Sea in the north and west direction, has currently represented itself as an epitome of influential traders amidst the globally growing importers. South Korea Import Data has represented the industrial energy consumption and the seasonal energy demand as the factors contributing to the overall hike in the import trade. The country has been heavily dependent on foreign resources for its export-driven economic structure.
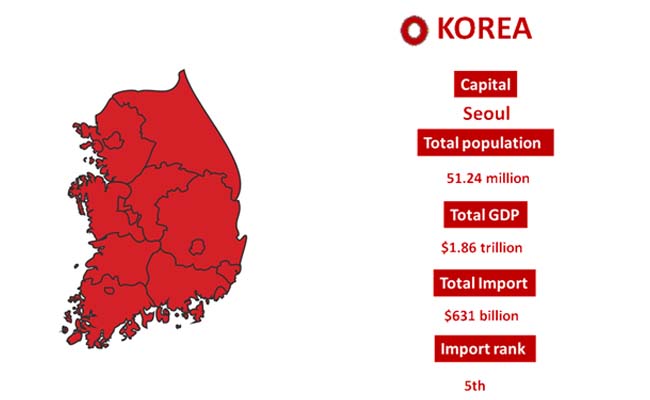
South Korea Customs Data has listed the import valuation of the nation at US$631 billion in 2025. The country has recorded a nominal global import trade ranking of 5th at present. The proper expansion of the electric vehicle production rate and artificial intelligence industries is contributing more to the imports of precision equipment and high-tech components. The port-driven imports, logistics, and dependence on strong import links for materials have contributed to the trade hike. Let's have an in-depth trade overview of the import economy of Korea, with the latest variants of goods imported from foreign sources and the top trade partners.