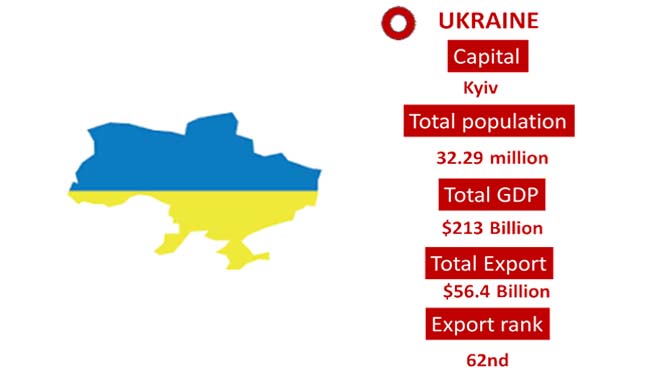
Ukraine Export Data

Ukraine Export Data

As per Ukraine export data the Ukraine is an emerging free market economy. Ukraine has many of the components of a major European economy like rich farmlands, a well-developed industrial base, highly trained labour, and a good education system

As per Ukraine export trade data, Ukraine is home to companies functioning in around 20 major industries, namely power generation, fuel, ferrous and non-ferrous metallurgy, chemical and petrochemical and gas, machine building and metal-working, forest, wood-working and wood pulp and paper, construction materials, light, food and others.

Ukraine export customs data shows analysis in 2018 Ukraine Export 54.8% product into Russia. Major export value by Ukraine delivered to European countries. As per Ukraine Export Statistics Ores, slag and ash was the fastest grower among the top 10 export categories, up by 56% from 2018 to 2019

As per the Ukraine export shipment data the value of merchandise exports from Ukraine totalled $ 47 billion in 2018. As according to Ukraine export trade statistics data merchandise exports from Ukraine increased by 8.99% compared to 2017. Goods exports grew up by $ 3.9 billion in 2018. The value of merchandise exports from Ukraine amounted to $43 billion in 2017.

What Information Contain In Ukraine Customs Data


Name of the Exporters

Name of the Exporters

List of exporters with names.
Address of the Exporters

Address of the Exporters

Address of exporting company with details of location.
Name of Importers

Name of Importers

List of companies who purchased the goods.
Address of Importers

Address of Importers

Address of importing company with details of location where goods arrived.
Hs Code

Hs Code

Harmonized Commodity Description and Coding System (HS Code) of tariff nomenclature is a international standardized system of names and numbers.
Product Description

Product Description

Detailed description of product of particular HS code as per recorded shipping or invoice bill.
Quantity

Quantity

Quantity of materials exported in different units.
Destination Country

Destination Country

Country where the product is exported.
Country of Origin

Country of Origin

Country of manufacture, production or growth where the product is exported from.
Date of Shipment

Date of Shipment

Shipment date as on the date of filling shipment/bill of lading at the time of custom clearance.

Ukraine Export Customs Trade Data Shows Top 10 Importing Products In 2018 – Analysis By Chapter

  • 20% for Chapter 72 – Iron and steel value of 9.93 billion US$
  • 15.2% for Chapter 10 – Cereals value of 7.24 billion US$
  • 9.49% for Chapter 15 – Animal or vegetable fats and oils and their cleavage products prepared edible fats; animal or vegetable waxes value of 4.49 billion US$
  • 6.41% for Chapter 26 – Ores, slag and ash value of 3.03 billion US$
  • 6.19% for Chapter 85 – Electrical machinery and equipment and parts thereof; sound recorders and reproducers, television image and sound recorders and reproducers, and parts and accessories of such articles value of 2.93 billion US$
  • 4.12% for Chapter 12 – Oil seeds and oleaginous fruits; miscellaneous grains, seeds and fruits; industrial or medicinal plants; straw and fodder value of 1.95 billion US$
  • 3.64% for Chapter 84 – Nuclear reactors, boilers, machinery and mechanical appliances; parts thereof value of 1.72 billion US$
  • 3.15% for Chapter 44 – Wood and articles of wood; wood charcoal value of 1.49 billion US$
  • 2.58% for Chapter 23 – Residues and waste from the food industries; prepared animal feed value of 1.22 billion US$
  • 2.34% for Chapter 73 – Articles of iron or steel value of 1.1 billion US$

Ukraine Export Global Trade Data Shows Top 10
Trading Partners
of Ukraine

  • Russia with a share of 7.71% (3.65 billion US$)
  • Poland with a share of 6.88% (3.25 billion US$)
  • Italy with a share of 5.55% (2.62 billion US$)
  • Turkey with a share of 4.96% (2.35 billion US$)
  • Germany with a share of 4.66% (2.2 billion US$)
  • China with a share of 4.64% (2.2 billion US$)
  • India with a share of 4.59% (2.17 billion US$)
  • Hungary with a share of 3.47% (1.64 billion US$)
  • Netherlands with a share of 3.38% (1.6 billion US$)
  • Egypt with a share of 3.28% (1.55 billion US$)

Ukraine Export Data Sample

Benefits Of Ukraine Export Data

1. FIND ACTIVE/LIVE BUYERS & SUPPLIERS: Ukraine export data is based on actual shipping bill documents. You will get active Importers & Exporters of your product with Ukraine export trade data. This is Ukraine export customs data it gives you result of most recent shipments globally.

2. FIND MORE LEADS: Ukraine export data allows you to gain insights in a relatively short amount of time, while your team can spend time on other things. You can directly reach to Buyers/Suppliers of your product and generate leads easily with the help of Ukraine export statistics data.

3. TRACK YOUR COMPETITIORS: It is vitally important to know who your competitor is and how they are performing. With the help of Ukraine export trade statistics data you can track your competitor shipments. To succeed in your respected industry, you need to understand who you’re up against. With the help of Ukraine export customs shipment data you can keep ‘eye wide open’ on each and every activity of your competitor.

4. EMERGING MARKET TREND: If you treat your market research as an ongoing exercise that you do periodically, you’ll find that you’ll have a lot of database to be able to analyses your customers and establish any particular trends. Ukraine export customs trade data are using by all Large, Medium & Small companies for more efficient Market analysis.

5. MINIMIZE ANY INVESTMENT RISK: For any business, it is very important to reduce any risk and minimize investment where possible to maximize their profit. By using Ukraine export data you can find easily which leads convert at a higher rate for a lower cost and you can cut out unnecessary spending.

6. KNOW YOUR CURRENT & POTENTIAL CLIENT: You will have all the details about your current and potential clients through Ukraine export trade database. Ukraine export customs data works as a fuel to your business and its success on many levels. These are the people who purchase and repurchase your product or service and are also the people who are recommending it to other potential future customers.

7. UNDERSTAND YOUR COMPETITION: A businesses competition can easily overtake them if they aren’t careful and do not pay attention to competitor’s actions. However, if the business were to monitor what their competition are doing they can make attempts to counter them more effectively. Through Ukraine export statistics data you can understand the active competition & threats in the market.

8. CREATE YOUR BUSINESS PLANS: For a good market plan it is very necessary to do regular research and find out your target market through Ukraine export data. A Business plan outlines what your overall objective is and should detail how you’re going to get there. Research is base for this plan and many companies benefited by Customs trade data which gives you real time analysis for your business plans.

Our Services

Export

We Import Globals provides you a platform to reach direct suppliers & buyers of your product. You can check by using our Ukraine export trade statistics data out all trade activities between Ukraine and other countries. We have recorded more than 80 million of shipment records from over 8 million businesses in 18 countries.

We have established top leading name in the market by serving more than 5000 clients and they are highly satisfied with our services.

Use right way to grow your business by using Import Globals Ukraine customs data

Our Expert team will be happy to provide you solution on your business through Global trade data.

You may also be interested in data of other CIS countries

Ask for Ukraine Export Sample Data and Demo

TOP