
Global Import-Export Trade of 2025: Trade Value, Deficit and Growth
- Nov 13, 2026
- 19 Views
Global Import-Export Trade of 2025: Trade Value, Deficit and Growth
The global trade has come across a remarkable growth rate in 2025 because of the growing development of international trade despite the complicated geopolitical situations.
As reported by the Global Trade Statistics, the trade volume has exceeded by 35 trillion U.S. dollars in 2025.The value of world merchandise exports was about $26.3 trillion; which is 7.2% more than in 2024. The merchandise imports showed increase as well as international trade continued to grow. Imports increased as corporations and consumers kept high demand for industrial materials, machinery, electronics, energy, and consumer goods. Global services exports exceeded $9.5 trillion, with an annual increase of 8.2%.
Though global trade is growing; the overall merchandise trade balance cannot be represented by a single global deficit. This is because the exports of one country make the imports of another country. The differences in freight and insurance costs and statistical reporting generate differences in the total import and export figures. Nowadays, increasing levels of trade are caused by the production of artificial intelligence-related goods and services, increasing demand, and the static demand rates as per the growing trade.
Global Trade at a Glance: The Summary of 2025
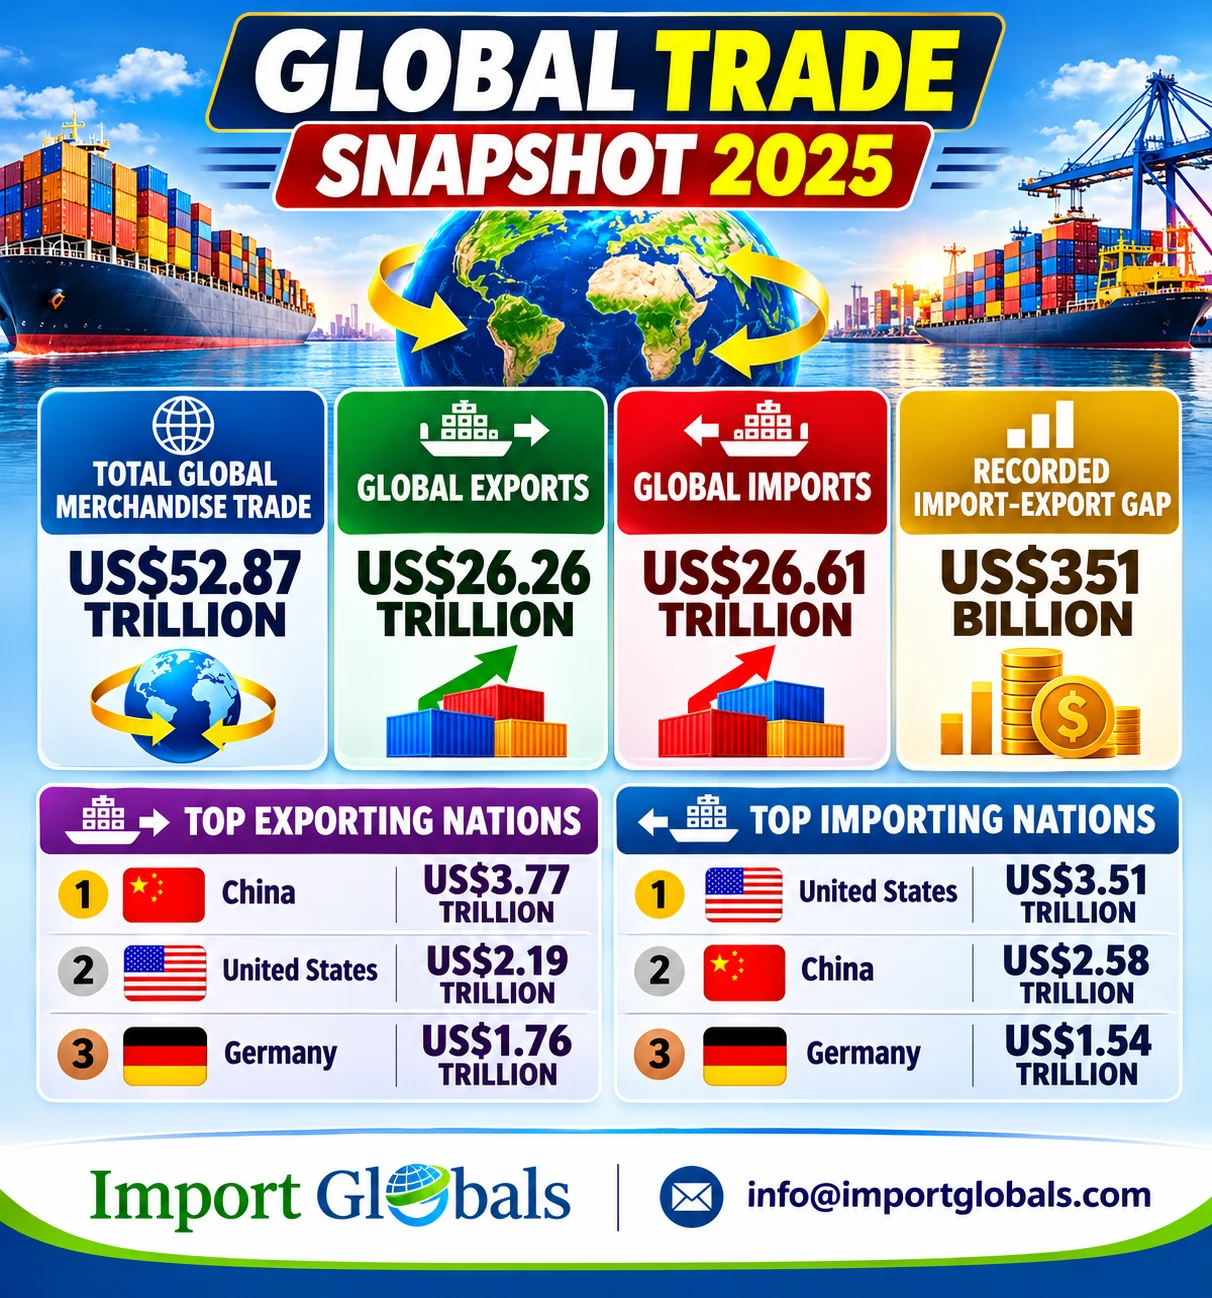
The statistics shown confirm that the total global trade in merchandise reached US$52.87 trillion, consisting of global exports of US$26.26 trillion and imports worth US$26.61 trillion. The Global Shipment Data also shows that the trade gap between imports and exports stood at US$351 billion. China is one of the leading exporting regions with a total export valuation of 3.77 trillion U.S. dollars, followed by USA and Germany with an approximate export valuation of 2.19 trillion and 1.76 trillion U.S. dollars in 2025.
The U.S. market right now holds the greatest potential of import with a valuation of 3.51 trillion U.S. dollars, with China coming second by a staggering rate of 2.52 trillion U.S. dollars. The ranking of the countries is a proper representation of the strong purchasing power and the substantial demand for the imported consumer and industrial goods. The Global Customs Data properly illustrates the interdependence of the global supply chains with leading exporters, effective supply rate. The integrated circuits are the topmost globally exported products because of the effective productivity and industrial automation.
Top 10 Globally Exported Variants
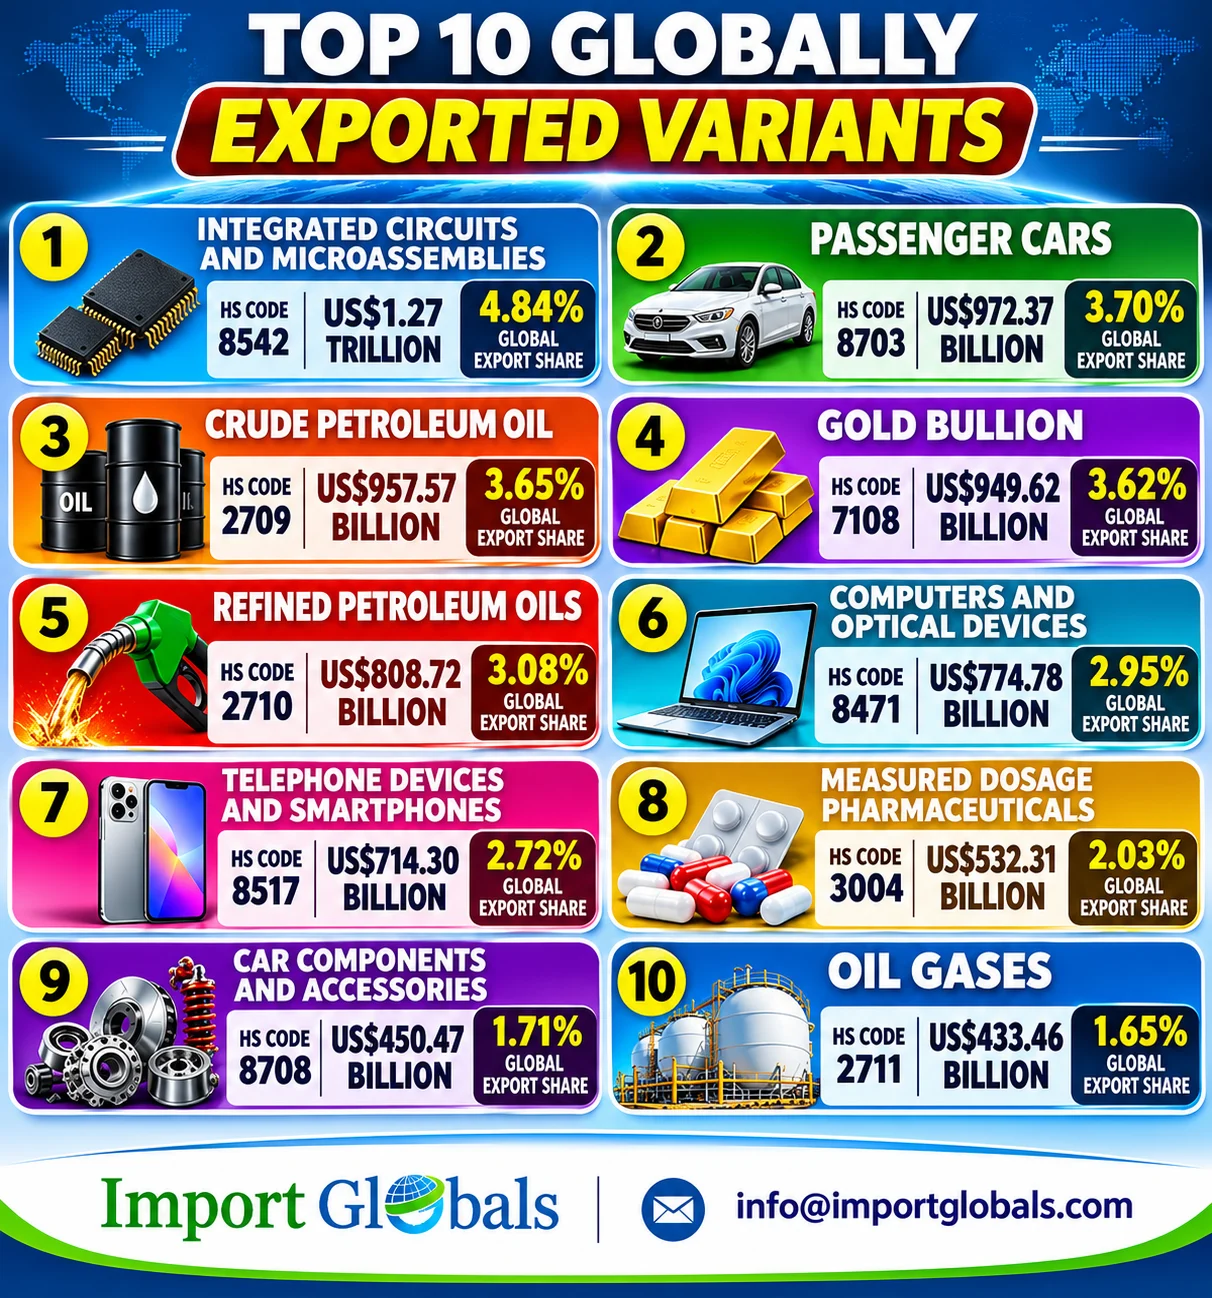
- Integrated Circuits and Micro assemblies — HS Code 8542 — US$1.27 Trillion | 4.84% Global Export Share
In 2025, integrated circuits were at the forefront of world exports, led by AI, data centres, smartphones, car electronics, and industrial automation. The need for semiconductors has formed the basis of international production and supply chains in the industry.
- Passenger Cars — HS Code 8703 — US$972.37 Billion | 3.70% Global Export Share
Passenger cars have held a distinct position among exports worldwide due to the global demand for traditional, hybrid, and electric cars. The automobile industry continues to build the connection between the largest producers and consumer markets.
- Crude Petroleum Oil — HS Code 2709 — US$957.57 Billion | 3.65% Global Export Share
Crude oil still remains the backbone of global energy trade by supplying petroleum refineries, transportation, and petrochemical industries. The export revenue reflects the state in the international market, changing depending on demand, level of production, and prices of oil.
- Gold Bullion — HS Code 7108 — 949.62 billion USD | 3.62% Global Exports
Exports of gold increased greatly in 2025 due to high prices and increased demand for investment. Bullion exports helped the financial market as well as the jewelry industry and cross-border metal deals.
- Refined Petroleum Oils — HS Code 2710 — 808.72 billion USD | 3.08% Global Exports
Refined petroleum oils were used in transport, manufacturing, and energy markets globally. International shipments included fuels and other oils which were affected by output of the processing industry and consumption tendencies, as per Global Export Data.
- Computers and Optical Devices — HS Code 8471 — 774.78 billion USD | 2.95% Global Exports
Computers and data processing devices had huge export demands due to digitization in business, cloud, and artificial intelligence investments. Global technology supply chains led to the need for advanced computing hardware.
- Telephone Devices and Smartphones — HS Code 8517 — 714.30 billion USD | 2.72% Global Exports
Smartphones and telecommunications technologies were of great importance for exports as consumers were getting new devices and companies were enhancing their productive capabilities.
- Measured Dosage Pharmaceuticals — HS Code 3004 — US$532.31 Billion | 2.03% Global Export Share
Pharmaceuticals produced in measured doses brought in extremely high export revenue because of global demand for healthcare and the existence of efficient manufacturing and distribution processes. It was necessary for exporters to meet the necessary regulations and maintain the required quality.
- Car Components and Accessories — HS Code 8708 — US$450.47 Billion | 1.71% Global Export Share
Car spare parts provided a framework for assembly, servicing, and repairs of vehicles all over the world. The demand for services such as the supply of motors, gear systems, braking systems, etc. was served through international auto manufacturing systems.
- Oil Gases — HS Code 2711 — US$433.46 Billion | 1.65% Global Export Share
The export of oil gases provided electricity generation, processing of different products, heating, etc. Investments into facilities and infrastructure appropriate for liquefied gas exports were determined by global demand.
Top 10 Globally Imported Variants
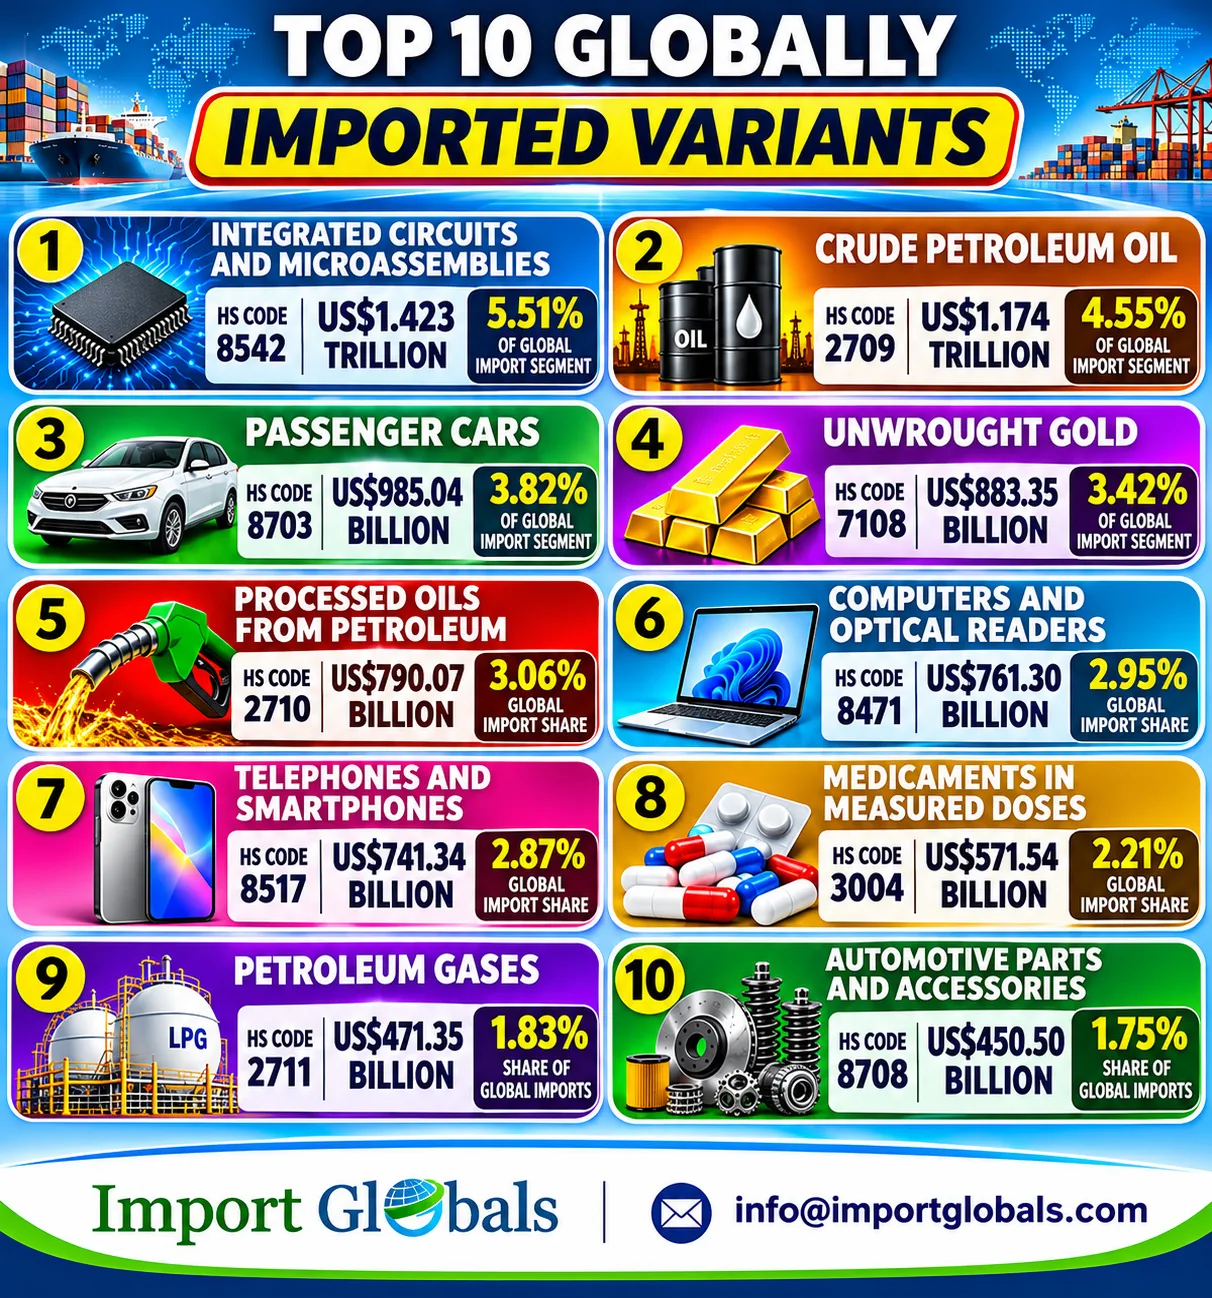
1. Integrated Circuits and Micro assemblies — HS Code 8542 — US$1.423 Trillion | 5.51% of Global Import Segment
For the year 2025, integrated circuits became the most exported item globally. This is driven by the high demand for semiconductors, the infrastructure of artificial intelligence, the rise of smartphones, the expanding field of automotive electronics, and advances in computers.
2. Crude Petroleum Oil — HS Code 2709 — US$1.174 Trillion | 4.55% of Global Import Segment
The exchange of crude oil became one of the biggest goods imported all over the world. Refineries and petrochemical industries are relying on the crude oil and crude oil signifies safety in the energy market, from the other side there should be considered potential changes in market consumption of crude oil.
3. Passenger Cars — HS Code 8703 — US$985.04 Billion | 3.82% of Global Import Segment
Passenger vehicles occupy a noteworthy portion within imported goods, including conventional, electric, and hybrid cars; represent the growing demand for the cars in both global and local markets.
4. Unwrought Gold — HS Code 7108 — US$883.35 Billion | 3.42% of Global Import Segment
Golden import in 2025 was highly appreciated on the global scale. People liked to invest in gold, which can lead to uncertainty in financial aspects and give opportunities for gold importers in the international market.
5. Processed Oils from Petroleum - HS Code 2710 - US$790.07 Billion | 3.06% Global Import Share
Processed oils from petroleum continued to be crucial for transportation, production, and energy supply. The international market was served with refined oils and related oil products to meet the industry requirements and domestic demand.
6. Computers and Optical Readers - HS Code 8471 - US$761.30 Billion | 2.95% Global Import Share
The market for computers saw an increase in imports with the growing demand for new technologies like artificial intelligence, cloud technologies, corporate technologies, and digital infrastructure. This led to an increase in international purchases needed for the functioning of the business, as per Global Import Export Shipments Data.
7. Telephones and Smartphones - HS Code 8517 - US$741.34 Billion | 2.87% Global Import Share
Telephones and smartphones have been the most popular items among imported electronics due to the fact of using mobile technology, replacing devices and adoption of technology solutions. The international network of manufacturers and distributors made it possible to satisfy the growing demand for the goods in business.
8. Medicaments in Measured Doses - HS Code 3004 - US$571.54 Billion | 2.21% Global Import Share
MDI continues to be crucial for the health care system of the world by supplying drug products, which make it possible to use medicines in hospitals and for personal use. International processes ensure proper delivery in effective doses as per the standard requirements.
9. Petroleum Gases - HS Code 2711 - $471.35 Billion | 1.83% Share of Global Imports
Petroleum gas imports help the industrial activities with electricity generation and other energy related activities. The growing resourcing by different authorities is a result of the increasing use in the industrial sectors.
10. Automotive Parts and Accessories - HS Code 8708 - $450.50 Billion | 1.75% Share of Global Imports
Imports of automotive parts were used for vehicle assembly, repairs, and replacement jobs. Specific elements like brakes, transmissions, and other devices connected to the car were facilitated by international supply chains that operate between manufacturers, distributors, and repair businesses.
Top 10 Leading Exporting Regions of the Global Market in 2025
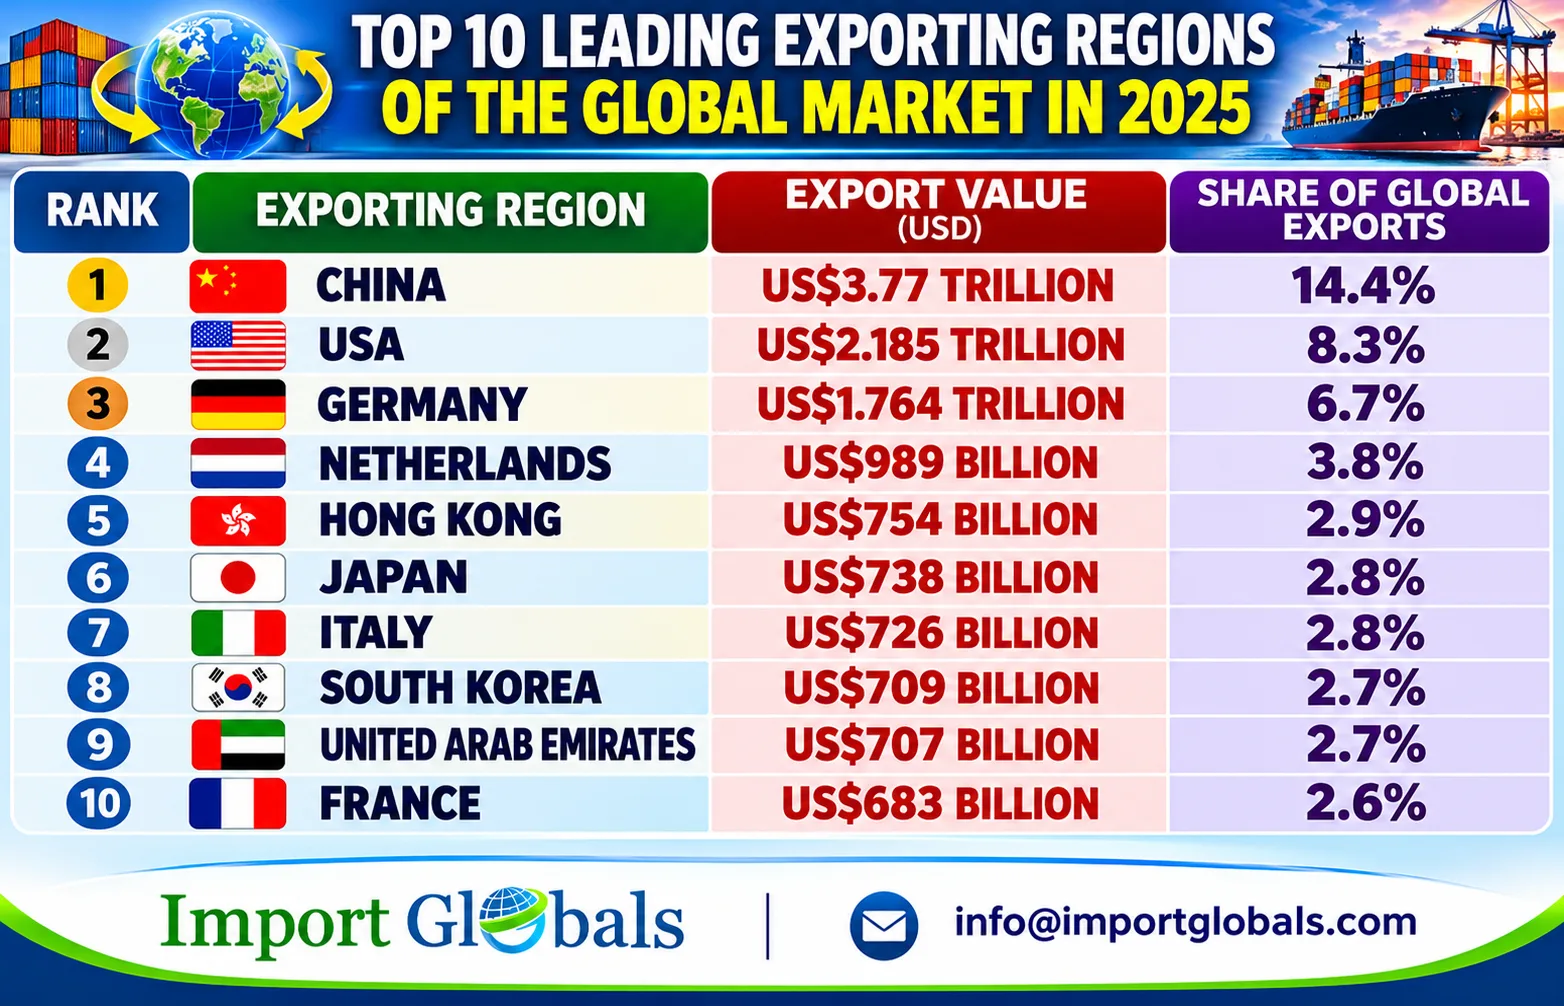
1. China — $3.77 Trillion | 14.4% Share of Global Exports
China has remained on top of the world’s exporters in 2025 due to support from electronic equipment, machinery, vehicles, textiles, and industrial gear. Because of a comprehensive manufacturing industry, China has been able to export to almost every corner of the world.
2. USA — $2.185 Trillion | 8.3% Share of Global Exports
The USA has maintained its position among the leading exporters in the world. Provided with a variety of products such as aircraft, machinery, oil and agricultural products, the US has been constantly exporting to its existing and potential markets around the world.
3. Germany — $1.764 Trillion | 6.7% Share of Global Exports
Germany continues to be an export leader thanks to its automobile production, industrial equipment, chemicals, and pharmaceuticals. Innovations in the field of engineering, strong manufacturing capabilities, and European integration contribute to the country’s successes in international trade.
4. Netherlands — $989 Billion | 3.8% Share of Global Exports
The Netherlands has gained strength as a European centre for exports mainly due to its large volumes of chemical production, machinery, agricultural products, and various petroleum products. Moreover, a developed port and transport system allows the country to enhance its position.
5. Hong Kong — US$754 Billion | 2.9% Global Share of Exports
Hong Kong has remained a prominent hub for exports and re-exports since it brought together Chinese manufacturers from the mainland and foreign investors. Electronics, telecommunications, and other sophisticated products were instrumental in its position in the global trade sector.
6. Japan — US$738 Billion | 2.8% Global Export share
Japan remained strong in the export of machinery, semiconductor equipment, electronic equipment, and automotive components. The country’s advanced machinery manufacturing and technology-based sectors continued being at the service of the automotive sector with industrial and consumer markets.
7. Italy — US$726 Billion | 2.8% Global Export share
Italy’s presence in global exports through machinery, pharmaceuticals, automotive, and fashion products was preserved. The demand in European and foreign countries was facilitated by the presence of many specialized manufacturers.
8. South Korea — US$709 Billion | 2.7% Global Export share
As a leading semiconductors and petrochemicals exporter, South Korea managed to keep its position by means of high-tech industries and globalized production networks.
9. United Arab Emirates - $707 billion | 2.7% Global Export share
Through petroleum, refined oil products, aluminum, precious metals, and re-imported goods, the United Arab Emirates has strengthened its international trade. Its geographical location and logistics infrastructure facilitate business between Asia, Europe and Africa.
10.France - $683 billion | 2.6% Global Export share
France has kept its position among leading exporters because of aircraft, medicines, cosmetics, machines, food products, and luxury goods. The industries and well-established distribution networks play an important role in global market supply, reported Global Trade Data.
Top 10 Leading Importing Regions of the Global Market in 2025
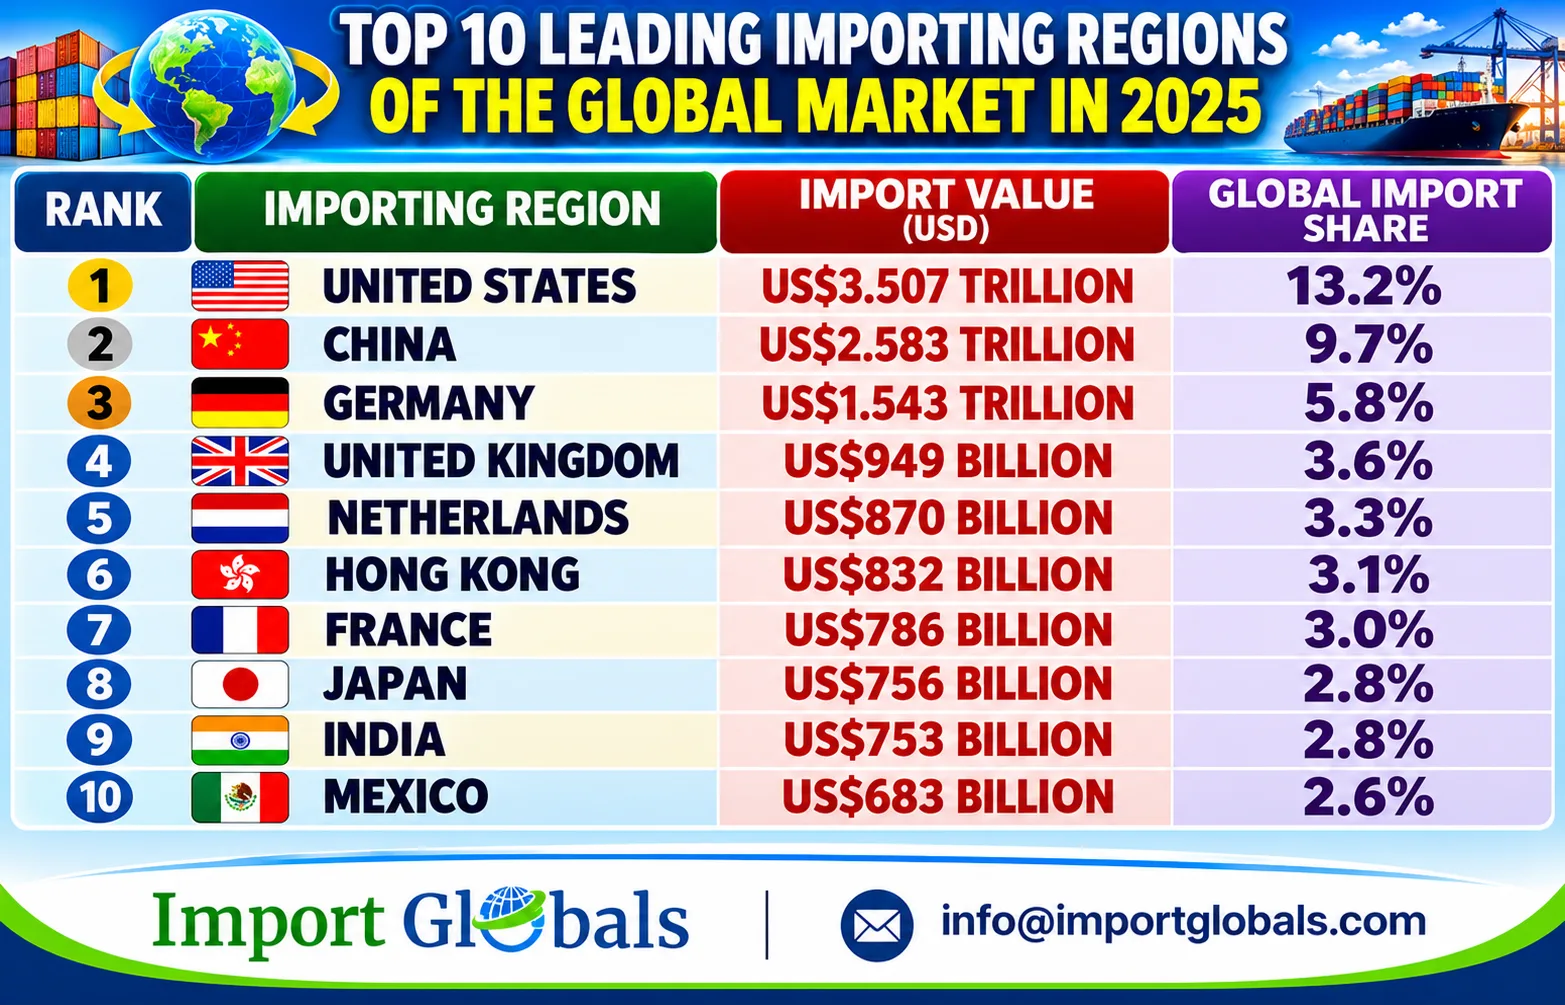
- United States — US$3.507 Trillion | 13.2% Global Import Share
The US is the leading country in imports in 2025, as it has imported electronic devices, machinery, vehicles, drugs, products of oil production, and consumer goods to support consumption and industry.
- China — US$2.583 Trillion | 9.7% Global Import Share
China remained one of the leaders in international imports, including crude oil, semiconductors, machinery, agricultural products, and industrial products to provide the country with manufacturing, power supply, and meet customers’ demand.
- Germany — US$1.543 Trillion | 5.8% Global Import Share
Germany continued to be one of the largest importing economies in the world and imported machinery, supply products, electronics, chemical products, and auto parts to make sure that the economy was functioning normally.
- United Kingdom — US$949 Billion | 3.6% Global Import Share
The UK imported a considerable amount of machinery, vehicles, electronics, pharmaceuticals, fuels, and consumer goods. According to data on international importers, the needs of customers in the UK were satisfied by foreign suppliers.
- Netherlands — US$870 Billion | 3.3% Global Import Share
The Netherlands has retained its status as a key importer of electronics, crude oil, machinery, chemicals, and agricultural products. The country’s seaports and logistical facilities facilitate reshipping operations across Europe.
- Hong Kong — US$832 Billion | 3.1% Global Import Share
Hong Kong continued to be a significant hub of international trade, marked by electronics, telecommunications equipment, precious metals, and consumer goods. The hub’s re-exporting process makes links between Asian manufacturers and buyers all around the world.
- France — US$786 Billion | 3.0% Global Import Share
France has been importing machinery, cars, electronics, medicines, fuels, and food. The imports help the country to support the market through consumer goods and ensure development of transport infrastructure, industry, healthcare, and retail.
- Japan — US$756 Billion | 2.8% Global Import Share
Japan has imported gas and oil, components for electronics, industrial materials, and food. The imports create opportunities for the country in terms of domestic consumption, consumption of goods, and production of technology.
- India — US$753 Billion | 2.8% Global Import Share
India has proved itself as one of the major importing countries in the world by importing not only crude oil but also gold, electrical equipment, industrial machinery, chemicals, and other industrial goods. Imports of these goods help India to reinforce its manufacturing capabilities, develop infrastructure, consume energy, and meet domestic demand.
- Mexico — US$683 Billion | 2.6% Global Import Share
Mexico imports electronic parts as well as machinery, automotive components, fuel, and industrial products for use in manufacturing and assembly. With the help of its supply chains, Mexico’s trade with the United States and Canada has been boosted, says Global Import Data.
Top 10 Leading Companies Ruling the Global Trade Market of 2025
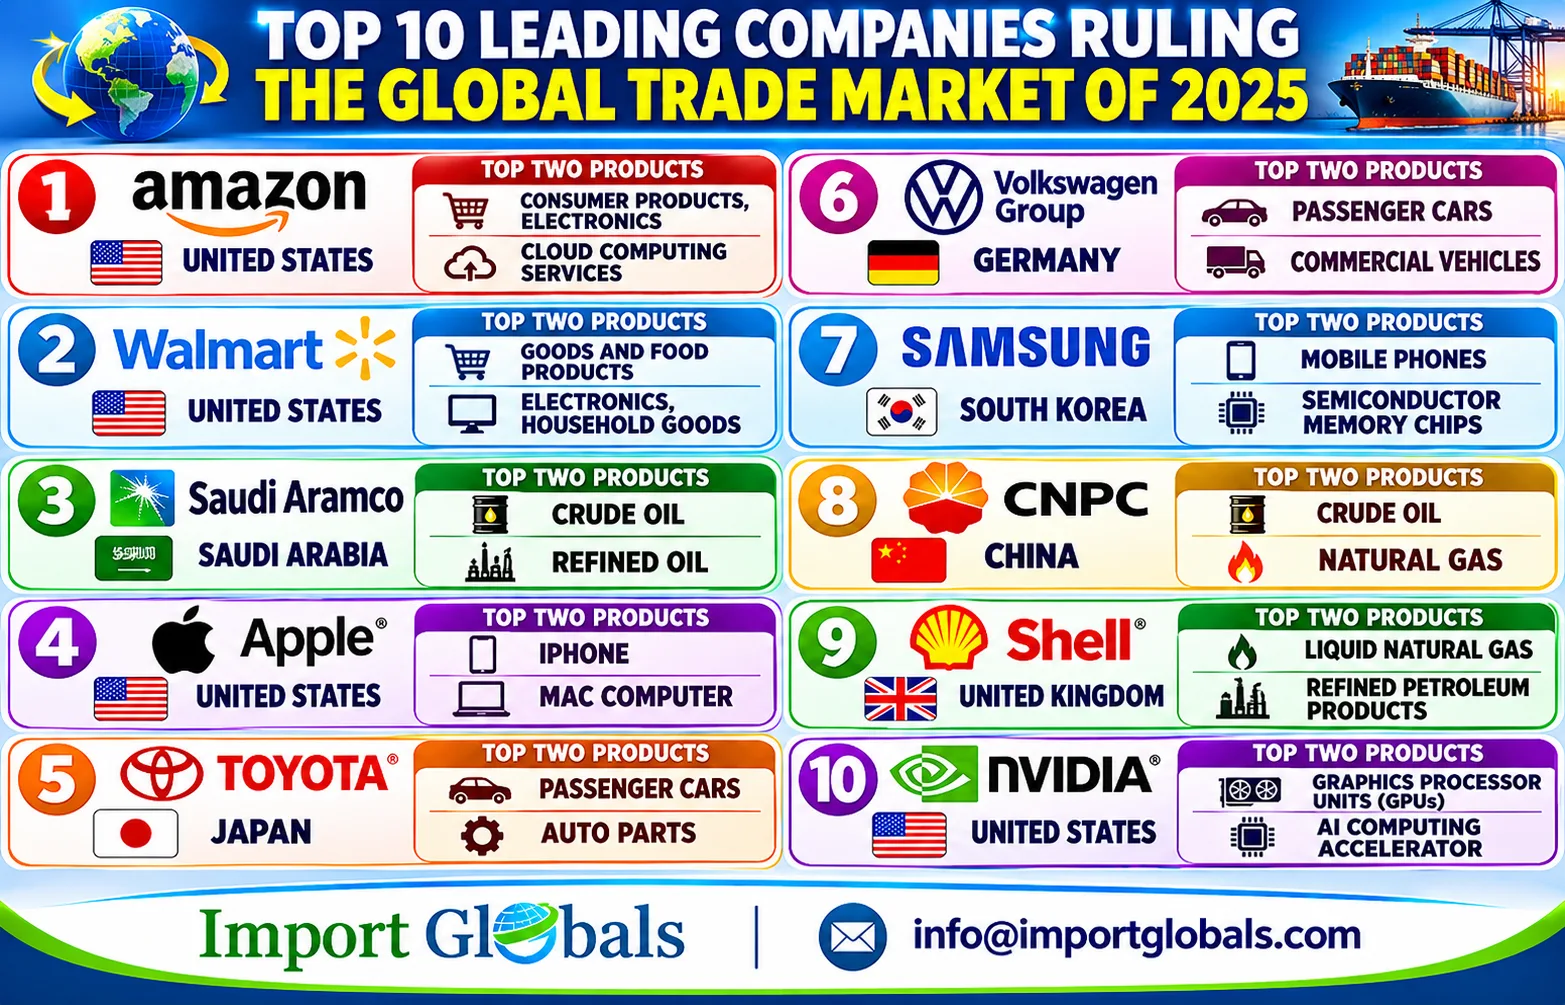
- Amazon — United States
Top two products: Consumer products, electronics; Cloud computing services.
Amazon controls international commerce with international marketplaces, fulfilment networks, and digital infrastructures. They can connect suppliers, manufacturers, and consumers everywhere within their logistics system.
- Walmart — United States
Top two product categories: Goods and food products; Electronics, household goods.
Walmart’s role in international trade is brought about through its sourcing activities, relationships with vendors across the globe, and logistics network management. Its sourcing process connects the producers of agricultural products, manufacturing firms, and producers to major retailers.
- Saudi Aramco — Saudi Arabia
Top two products: Crude oil and refined oil.
Saudi Aramco’s role in international trade is through the supply of crude oil and other products across borders. The bilateral integrity is maintained with the effective production of the specific industry.
- Apple — United States
Top two products: iPhone, Mac computer.
Apple’s role in international trade is providing electronic devices across borders. The connectivity across strong manufacturers has been driving the overall demand rate because of the strong relationships with traders.
- Toyota Motor Corporation - Japan
Top two products: Passenger cars; auto parts.
Toyota promotes international automotive trade through its vehicle exports, foreign production, and part sourcing worldwide. It has a global production network for cars, engines, transmissions, and spare parts.
- Volkswagen Group - Germany
Top two products: Passenger cars; commercial vehicles.
Volkswagen promotes international automotive business through its global car production and vehicle exports. The group has many brands and manufactures parts in different countries as well, says Global Trade Statistics.
- Samsung Electronics - South Korea
Top two products: Mobile phones; semiconductor memory chips.
Samsung promotes international technology trade by manufacturing mobile phones, memory chips, and electronic components. The company connects countries in the process of contracting for the technology.
- China National Petroleum Corporation - China
Top two products: Crude oil; natural gas.
The CNPC promotes international business in the field of energy by establishing links between energy sources and refiners, power companies, and clients in other countries.
- Shell - United Kingdom
Top two Products: Liquid natural gas, Refined petroleum products.
Shell provides valuable services in energy trading via its transport and delivery of natural gas and petroleum products. Through its creation of integrated supply chains, the company facilitates connections between energy producers and both industrial and commercial customers.
- NVIDIA - United States
Top two Products: Graphics processing units (GPUs), AI computing accelerators.
NVIDIA contributes to worldwide technology supply chains through the provision of processors for artificial intelligence and gaming. The company’s products help to create an international demand for semiconductors and electronic components.
Global Trade Statistics Highlights: The Past 10 Years' Growth
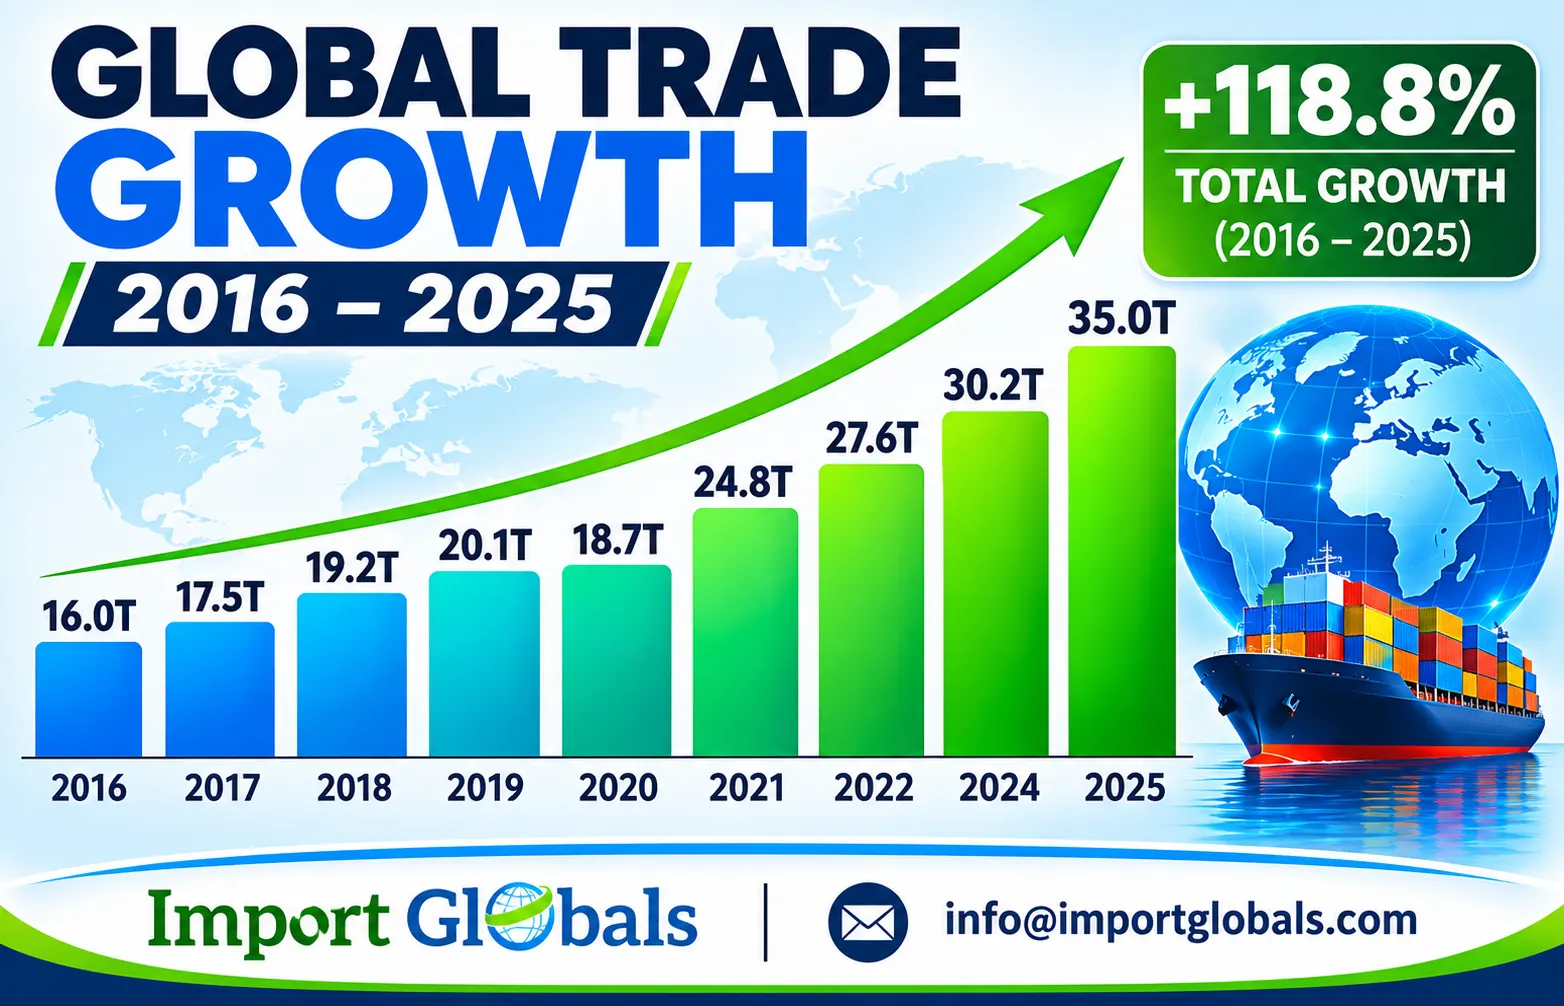
The global trade landscape saw significant growth in the decade spanning from 2016 to 2025. Global trade equal to about US$16.0 trillion in 2016 increased to US$35.0 trillion in 2025; representing an increase of 118.8 %. Trade value reached US$17.5 trillion in 2017 and US$19.2 trillion in 2018, and then climbed to US$20.1 trillion in 2019, says Global Trade Data.
The upward trend continued, and the global trade value rose to US$27.6 trillion in 2023 and US$30.2 trillion in 2024, before culminating in the value of US$35.0 trillion in 2025, thus reflecting the importance of international supply chains, manufacturing networks, digital commerce, and cross-border demand for energy, technologies, engineering machines, and consumer goods. The arrow going upwards symbolizes the growing pace of global trade, and the globe and the ship represent maritime transport means.
Problems of Global Trade in 2025: Tariffs, Geopolitics and Supply-Chain Risks
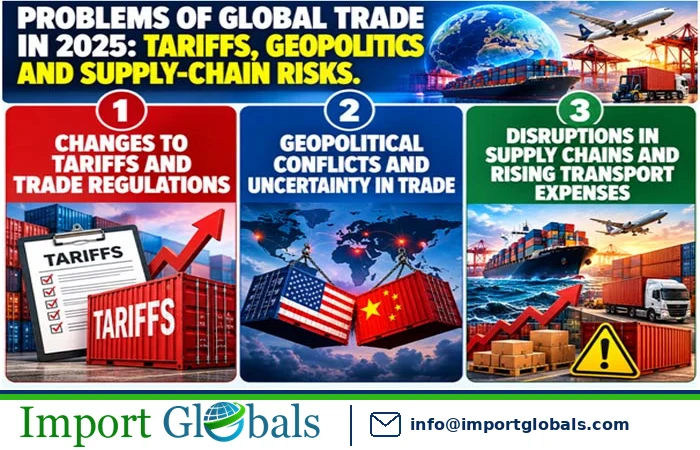
- Changes to Tariffs and Trade Regulations
In 2025, the issue of tariffs and import duties became quite troublesome and complex. Increasing costs of trade made it more difficult to set prices, choose suppliers, access markets, and compete across borders.
- Geopolitical Conflicts and Uncertainty in Trade
Geopolitical conflicts and trade disputes hampered established trading relations, which led to confusion over trade policy, export restrictions, access to markets, and, most importantly, trust in other international trading partners.
- Disruptions in Supply Chains and Rising Transport Expenses
Delays in transportation, logistics costs, and disruptions on major trade routes worked against global trade. In response to this, companies diversified their suppliers, modified stock maintenance strategies, and sought alternative methods of transporting goods.
Future Trade Outlook of Global Trade
Global trade is believed to continue playing a crucial role in the development of economies, industries, and businesses in the post-2025 period. Due to the growing demand for artificial intelligence, semiconductors, computers, telecommunication devices, and high-tech equipment, manufacturers and merchants can potentially benefit from new possibilities.
China, the United States, Germany, Japan, and some other large trading countries are likely to retain their dominant positions in global trade thanks to their production capacities and experience in technology and commerce. Emerging countries, such as India and other countries in Asia, can also expect an inflow of business in response to the diversification of product sourcing strategies and the search for new consumer markets.
Conclusion
Global trade in 2025 highlighted the role of international commerce in bringing together different parties in the market process. In this regard, the statistics demonstrate that the biggest share of exports and imports in the world belongs to China, the USA, and Germany, showing a great demand for integrated circuits, petroleum, passenger cars, computers, medicines, and automotive equipment. The growth of global trade in the period of 2016-2025 reveals another point: an increasing interdependence of the global supply chain and the importance of logistics, reported Global Trade Statistics.
While this growth takes place, companies have to deal with tariff ambiguity, geopolitical issues, changing commodity prices, and international regulations. Finding appropriate markets, figuring out the classification of products (e.g., tariffs), and understanding the buying behaviour of partners are the keys to the successful decision-making process when it comes to trade. Import Globals can assist businesses with access to import-export statistics, customs statistics, and shipment-level data that are going to help realize trade opportunities, understand trade behaviour, as well as provide companies with essential data for building a strong international trade strategy.
CTA
If you are trying to have the latest updates regarding the global trade outlook for 2025, then you have come to the right platform here. Import Globals helps businesses stay updated with the active insights of the global marketplace. Subscribe to www.importglobals.com or drop an email at [email protected] for detailed insights into the global trade market in order to drive your international business growth.
FAQ’s
Que. Name the largest exporting region of the global market in 2025.
Ans. China is the largest exporting region of the global market in 2025.
Que. Name the largest importing region of the global market in 2025.
Ans. The United States is one of the largest importing regions of the global market in 2025.
Que. Name the product that has been dominating the global exports of 2025.
Ans. Integrated circuits and passenger cars are the products that have been dominating the global exports of 2025.
Que. Name the most imported products on a global scale in 2025.
Ans. Integrated circuits, crude petroleum, and passenger cars are the most imported products in the global market in 2025.
Que. What is the global export trade value of 2025?
Ans. The global export trade value of 2025 is 26.26 trillion US dollars.
Que. Name the factors influencing global trade growth.
Ans. Artificial intelligence and semiconductor demand rate are some of the top two factors that have been influencing global trade growth.
Que. How does Global import-export data support business growth?
Ans. Global import-export data supports business growth via proper identification of buyers and suppliers, analysis of market demand, and development of effective market expansion strategies.
Que. What information is available in Global trade data?
Ans. Global trade data covers importer name, exporter name, shipment date, HS code, product details, quantity, pricing information, origin country, importing country, and port details.
Que. How frequently is the Global trade data updated?
Ans. Global trade data is updated on a monthly basis.
Que. Where can you obtain detailed information on Global trade data?
Ans. Visit www.importglobals.com or drop an email at [email protected] for detailed updates on Global trade data.
You Can Also Visit :-
