Russia Customs Data: A Comprehensive Guide for Progressive Importers and Exporters
- Aug 21, 2026
- 45 Views
Russia Customs Data: A Comprehensive Guide for Progressive Importers and Exporters
Russia is one of the largest traders in the present day, mainly because of the extensive natural resource base, large industrial sector, strategic geographic location, and diversified international trade relationships.
Russia Customs Data is responsible for providing valuable visibility into import and export activities as the main factors promoting the country's trade ranking. Importers, exporters, manufacturers, distributors, and logistics are making better sourcing and international expansion decisions with the latest updates.
The Asian markets are increasingly important because they support energy, metals, agricultural commodities, chemicals, and machinery trade. Russia Trade Data reported that the country has recorded a foreign trade turnover of 699 billion U.S. dollars in 2025, with 420 billion U.S. dollars of exports and 282 billion U.S. dollars of imports. The trade landscape is continuously evolving, and the growth rate is projected at 8.5% on a year-on-year basis. Asian countries will account for the largest portion of the Russian trade flows.
Why is Russia a Major Trading Nation?
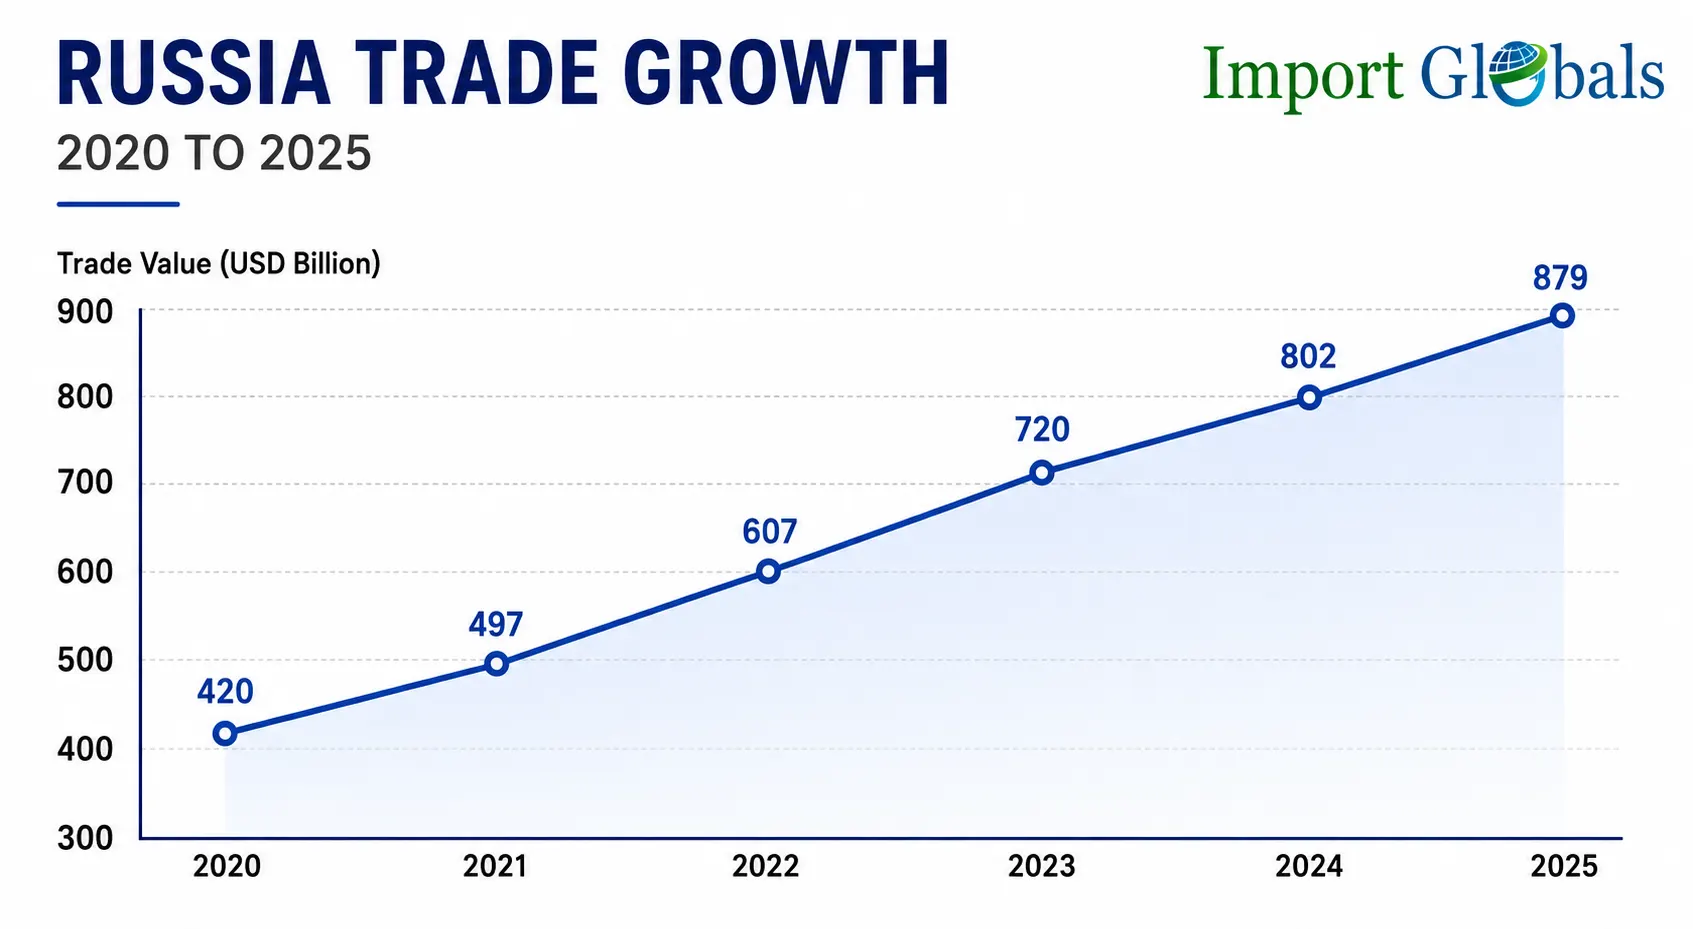
Russia Shipments Data reported the nation as one of the major trading hubs because of the enormous reserves of crude oil, natural gas, coal, metals, minerals, agricultural resources, and other raw materials. The historical trade creation is backed up by downstream industries like refining, petrochemicals, metallurgy, machinery, food processing, and chemicals. The geographical position has provided reliable access to Europe, Asia, the Middle East, and the Arctic.
Different ports on the Baltic, Black Sea, Pacific, and Arctic routes have maintained the connectivity of trade with relevant shipments to Asian destinations. The crude oil shipment to Asia has led to an increase in several shipments, increasing on a global demand scale. Russia's trade relationships have shifted towards Asia says Russia Trade Statistics. The total trade turnover, compared to 18.6% for European countries, has maintained the statistical growth rate.
Russia's Import Economy in 2025
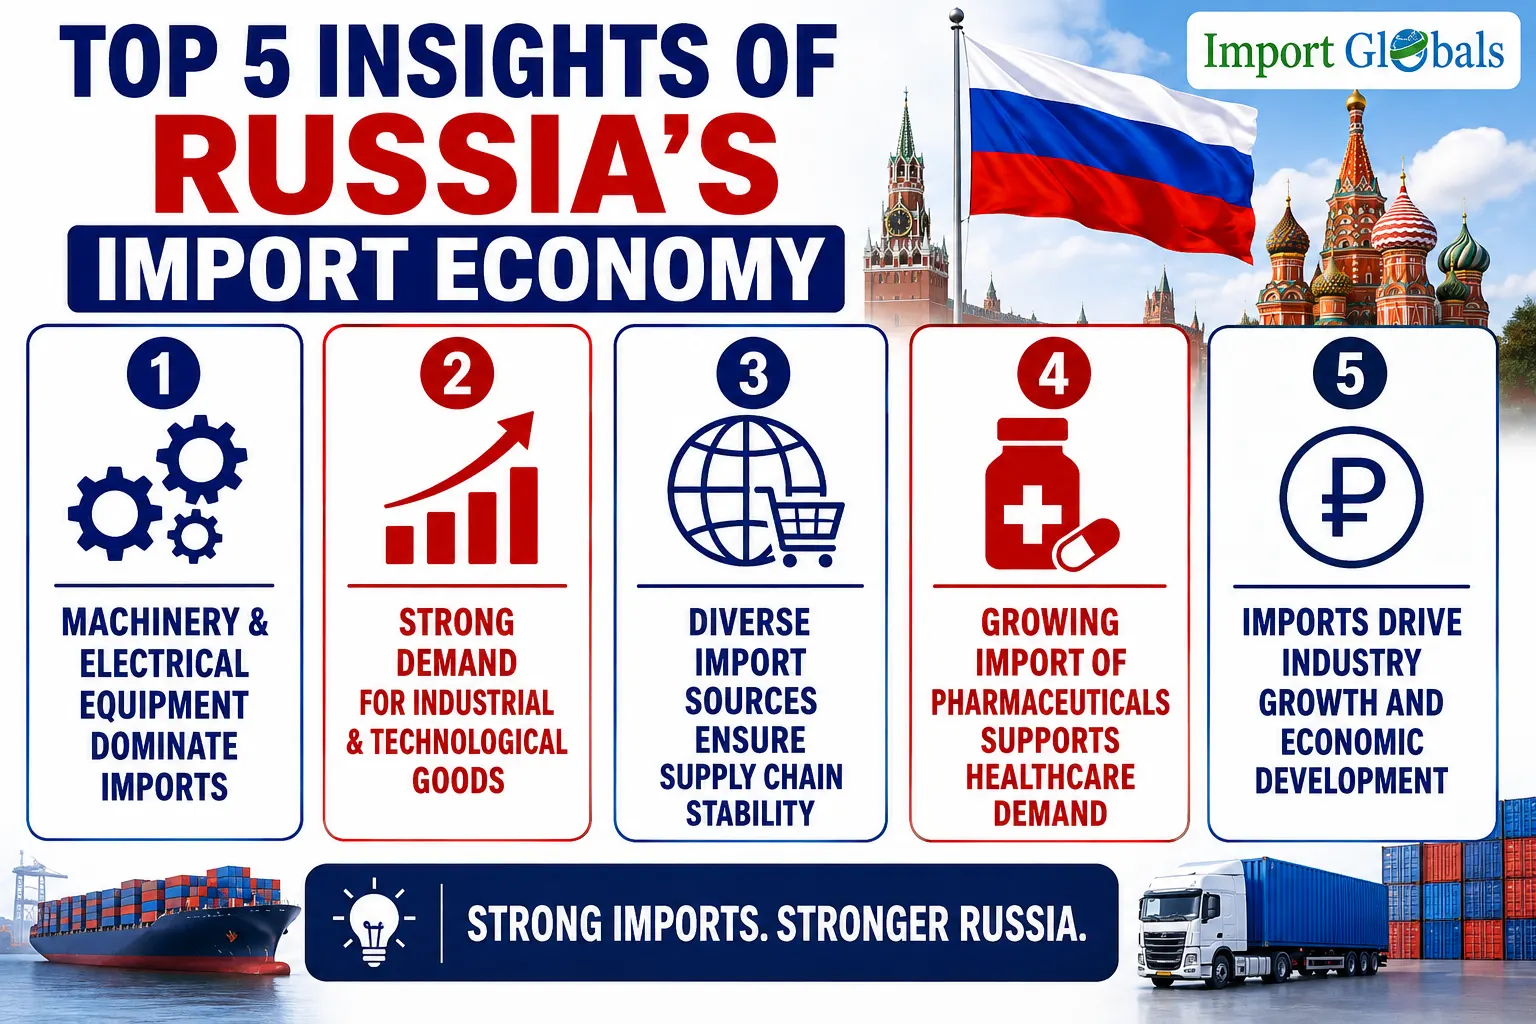
The import economy of Russia is closely connected to industrial production, infrastructure development, healthcare technology, and manufacturing. The resourcing of machinery and equipment, electrical products, transport equipment, and chemicals has maintained the importance of the import structure.
Russian imports have demonstrated the changing nature of the national supply chain, says Russia Import Data. Asian suppliers have maintained a significant role in it, with the maintenance of the trade position and the largest trading partners. The Chinese authorities accounted for 36% of Russia's imports in 2025.
Top Imported Variants of Russia in 2025
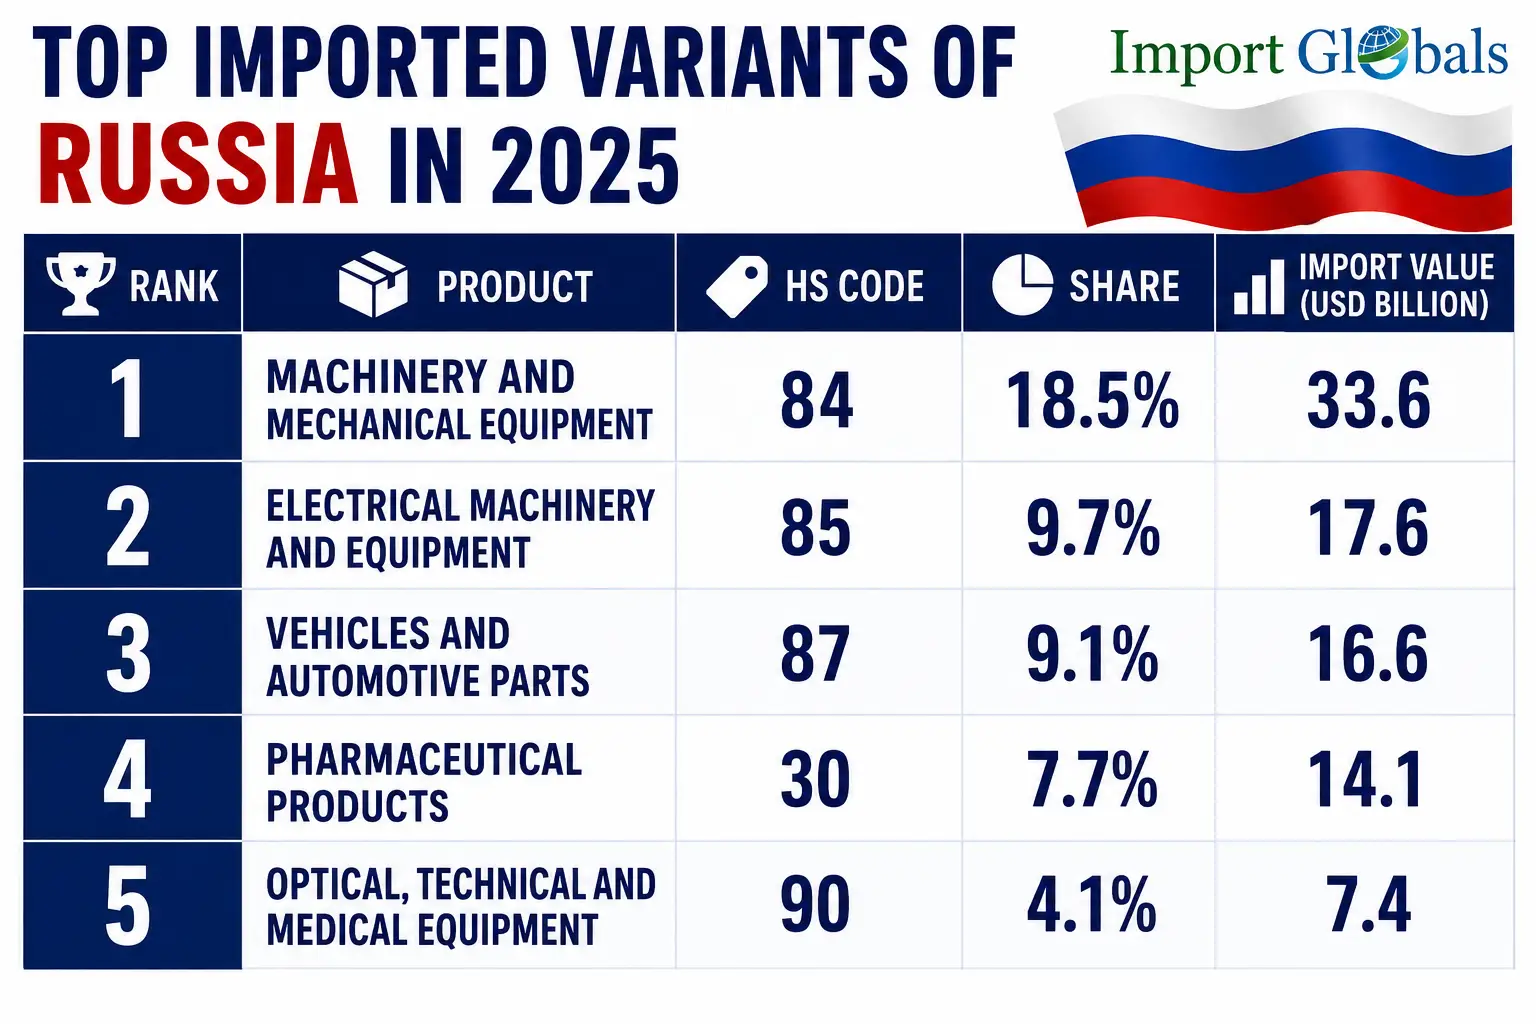
- Machinery and Mechanical Equipment (HS Code 84) — 18.5% Share | US$33.6 Billion - Russia Import Customs Data reported machinery and mechanical equipment as the top imported variants of Russia. The share of the specific product is 18.5% of the overall import market share. Russia imported products worth 133.6 billion US dollars in 2025. The top-resourced essentials include industrial machinery, computers, production equipment, engines, electrical machinery, and equipment.
- Electrical Machinery and Equipment (HS Code 85) — 9.7% Share | US$17.6 Billion - Russia Customs Data listed electrical machinery as a significant imported essential. The specific category covers electrical equipment, electronic components, telecommunications, electrical appliances, and other related technologies. The total valuation of electrical machinery imported into the nation in 2025 includes 17.6 billion US dollars of trade.
- Vehicles and Automotive Parts (HS Code 87) — 9.1% Share | US$16.6 Billion - Vehicles and automotive parts are also the latest resourced essential from foreign authorities. Russia imported vehicles worth 16.6 billion US dollars in 2025. The changing supply landscape and the automotive trade hold importance in the import economy.
- Pharmaceutical Products (HS Code 30) — 7.7% Share | US$14.1 Billion - Pharmaceutical products are imported worth the valuation of 14.1 billion US dollars in 2025. Medicines, pharmaceutical preparations, active ingredients, and other healthcare-related products have supported the country's healthcare. Pharmaceutical imports have recorded a growth rate as compared to the previous year.
- Optical, Technical and Medical Equipment (HS Code 90) — 4.1% Share | US$7.4 Billion - Optical, technical, precision, medical, and surgical equipment account for 7.4 billion US dollars of imports. The overall trade representation is 4.1% of the total imports of Russia. The category encompasses diagnostic equipment, medical instruments, measuring devices, optical equipment, and precision instruments.
Top Five Exported Variants of Russia in 2025
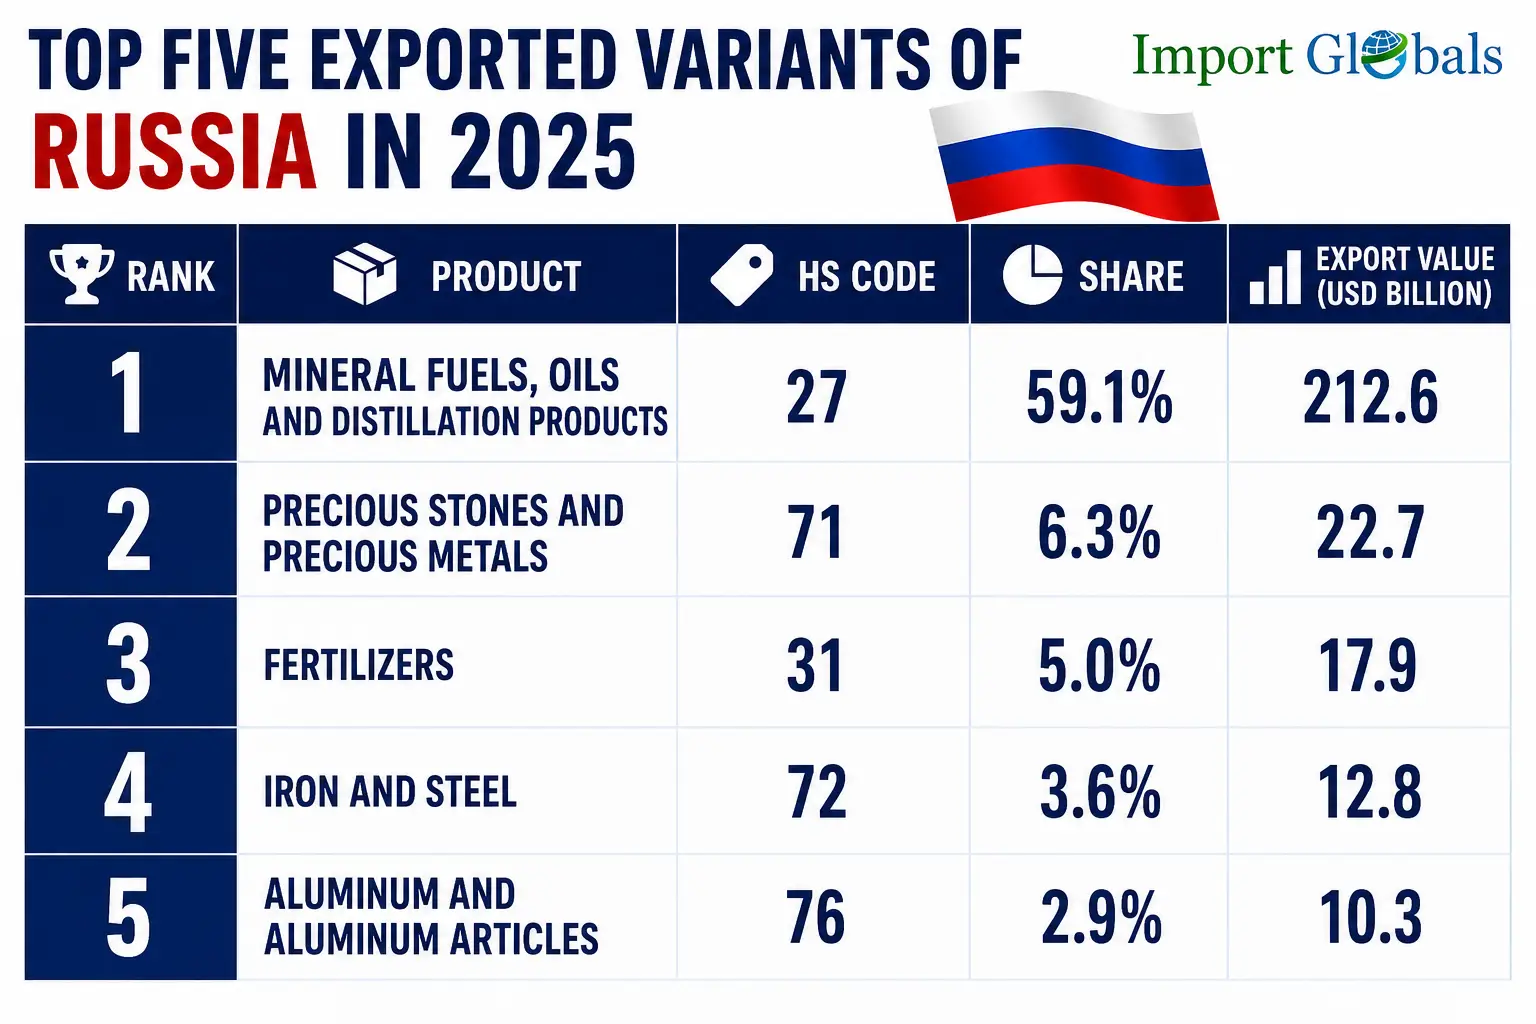
- Mineral Fuels, Oils and Distillation Products — HS Code 27 — 59.1% Share | US$212.6 Billion - Mineral fuels are exported worth a valuation of 212 billion US dollars in 2025. Crude petroleum, refined petroleum, natural gas, and other mineral fuel products are the top exported variants as reported by the Russia Export Data.
- Precious Stones and Precious Metals — HS Code 71 — 6.3% Share | US$22.7 Billion - Precious stones and precious metals account for 6.3% of the total exported goods of Russia. Gold and other precious metals report important components of the category, according to Russia Statistical Data. The industry has been supporting international shipments while solidifying Russia's export growth rate.
- Fertilizers — HS Code 31 — 5.0% Share | US$17.9 Billion - Fertilizers account for a 5% share of Russia's overall exports. The nitrogenous, potassic, and mixed fertilizers are among the latest exported products within the category. The large natural gas and mineral resource base provides important inputs for fertilizer manufacturing.
- Iron and Steel — HS Code 72 — 3.6% Share | US$12.8 Billion - Iron and steel are exported worth a valuation of 12.8 billion US dollars in 2025. The category basically includes iron and steel products, semi-finished materials, flat-rolled products, and other metallurgical goods. The establishment of the mining and industries has maintained the proper export of industrial metals says, Russia Customs Shipments Data.
- Aluminum and Aluminum Articles — HS Code 76 — 2.9% Share | US$10.3 Billion - Wrapping up the list of the most exported variants of Russia, aluminum and aluminum articles are the latest exported variants. It accounts for 2.9% of the total exports, and the export value is 10.3 billion US dollars in 2025. The sector mainly benefits from Russia's substantial aluminum product capacity.
How Does Russia Customs Data Support Business Growth?
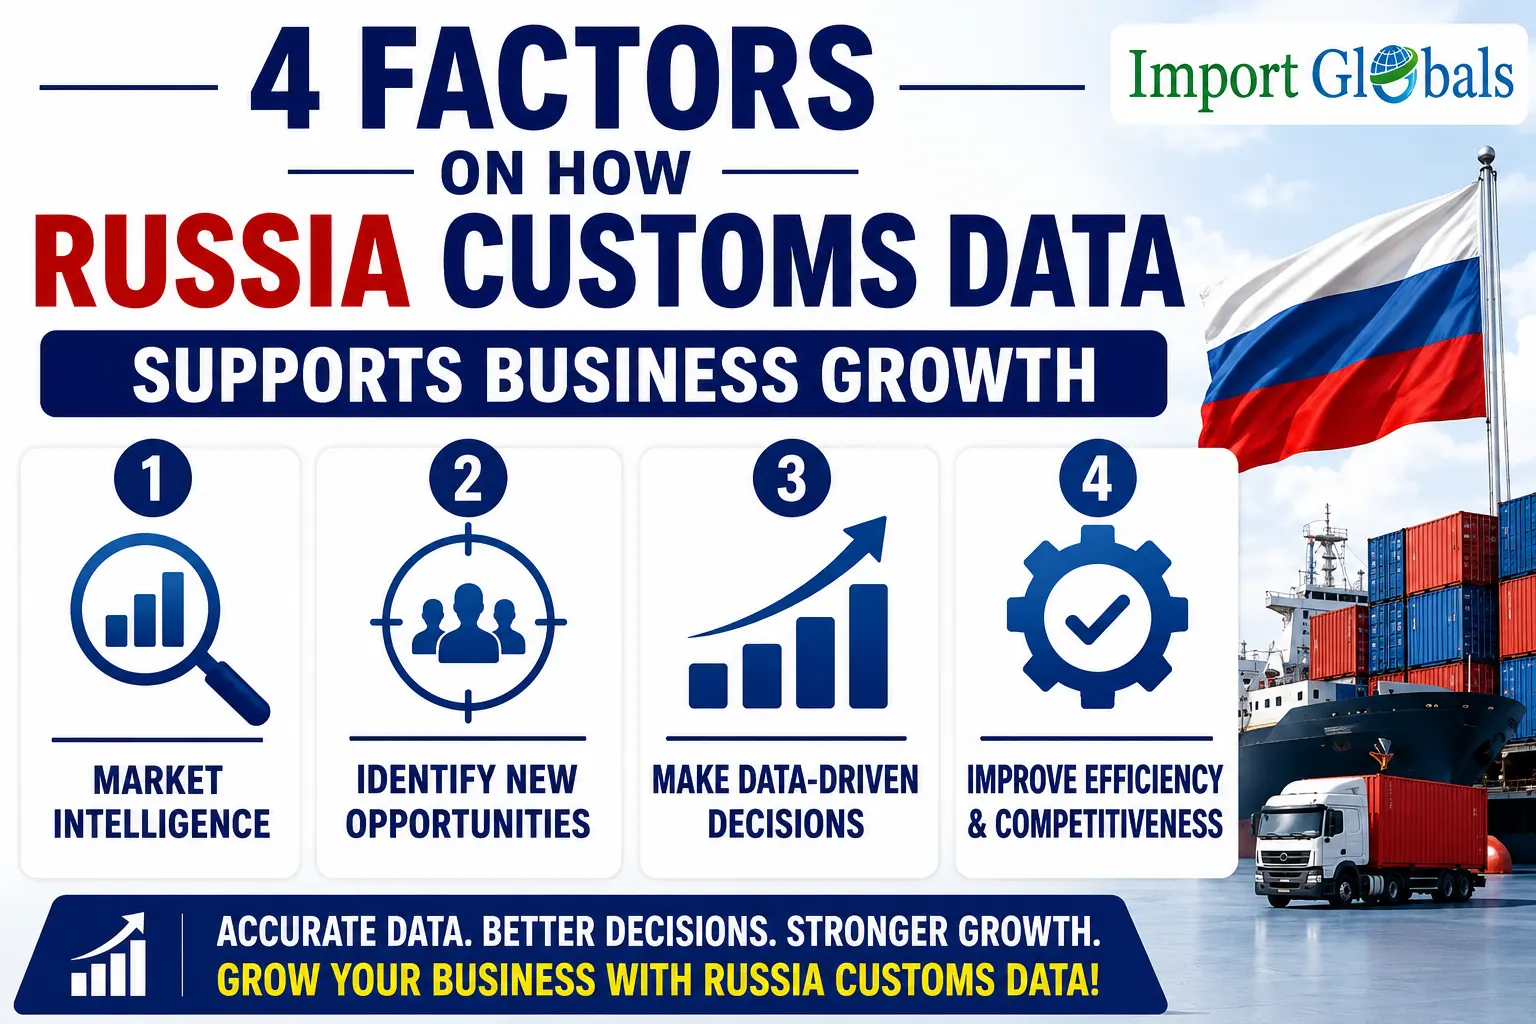
Russia Customs Trade Data is considered a detailed dataset that contains all the information regarding the imported and exported goods of the nation. Trade intelligence for organizations has been valuable because it supports understanding of the marketing movements and international supply chain. Businesses can properly use the Russia Trade Import Data for identification of the importers and exporters, product descriptions, HS code, shipment quantities, shipment values, and destination markets. The understanding of the supplier and buyer relationship gives the proper evaluation to the business authorities regarding the latest traded variance.
The importers looking for industrial suppliers can examine the activity by HS code, product description, origin market, and shipment volumes. The exporters can similarly get a proper evaluation of the Russian buyers for identification of specific products that are demanded worldwide. This overall approach helps the authorities in reducing sourcing uncertainty while helping the companies develop more targeted sales.
Top Export Partners of Russia in 2025
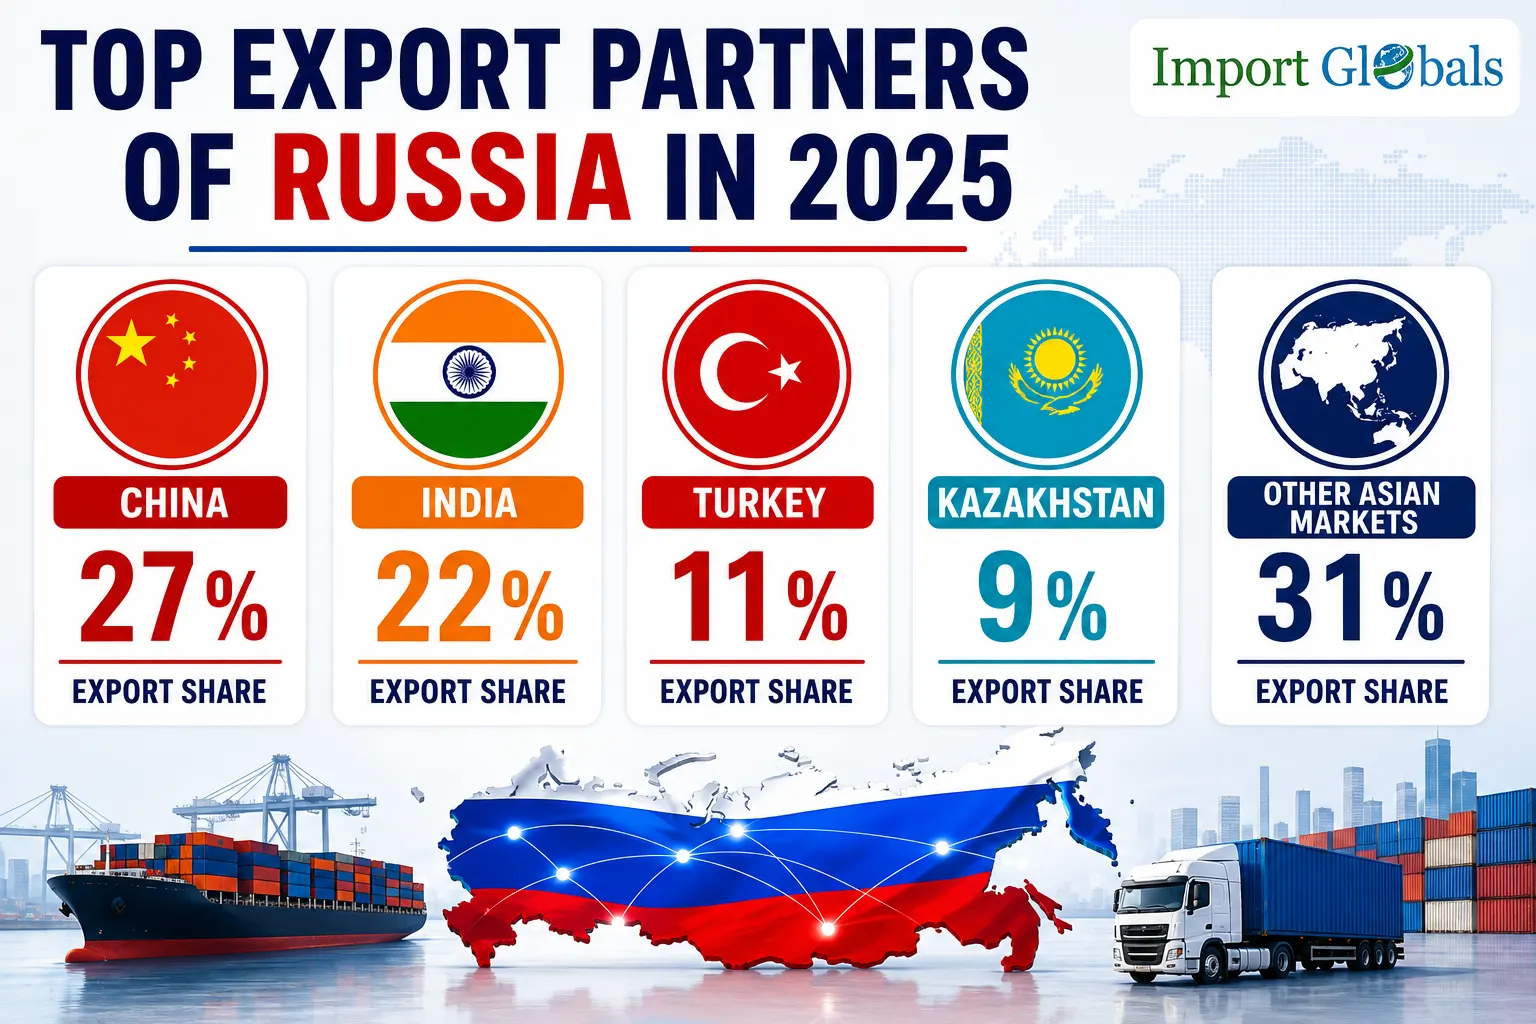
- China - China Import Data listed China's authorities as one of the top regions supporting the destination exports of Russia. Energy products, metals, minerals, agricultural commodities, and other raw materials are the main traded commodities from Russia to China. China alone accounted for 27% of the Russian exports.
- India - India is also a significant importer of Russian traded essentials, mainly because of its growing consumer demand rate. The proper hike in crude imports has benefited the bilateral integrity of both the nations. The significance of the bilateral energy relationship is supported by the overall trade height.
- Turkey - Turkey Import Data reported the nation itself as a major destination supporting Russian trade growth. The specific resourcing of metals, agricultural goods, and other industrial materials has supported effective trade. The bilateral integrity of Turkey and Russia is supported by the growing demand rate of Turkey's consumer base regarding agro-essentials and other machinery.
- Kazakhstan - Kazakhstan Import Data listed the effective resourcing of machinery, agricultural products, chemicals, and manufactured goods as the main factors crafting the overall trade of Russia to Kazakhstan in 2025. The geographical proximityhas maintained the proper trade significance of both regions while supporting the trade.
- Other Asian Markets - The Asia Import Data has been a massive destination for Russian trade. The exports to Asia from the Russian authorities have sent over a staggering valuation of 141.5 billion US dollars, mainly because of the exports to the European Union, African region, and the American continent.
Future Trade Outlook of Russia
The Russian export authorities have been continuously dependent on the effective trade of energy, industrial essentials, agricultural commodities, and other traded categories. The growing demand rate from the Asian region and geopolitical developments, along with logistical infrastructure, have supported the export trade. Russia Export Trade Data reported the diversification of the export structure as the main factor maintaining the country's overall trade growth.
Russian exports have increased by a rate of 8.5%, while imports have increased by a rate of 8.1% at present. The geographic concentration of trade toward Asia has strengthened the country's overall ranking. The energy sector will be a major component of Russian exports, but agricultural fertilizers and metals will contribute to further diversification. The expansion of Arctic shipping will support the Russia-Asia trade. International businesses and future opportunities will mainly depend on the identification of high-demand products. The transportation routes and customs requirements will support the overall bilateral integrity of the nation.
Key Takeaways of Russian Trade in 2025
- The Russian trade turnover is 697 billion US dollars in 2025.
- The exports of the nation have declined by 3.7 percent on a year-on-year scale, while the imports have decreased by 1.4 percent at present.
- The energy sector has served as the backbone of Russian exports.
- Asia is the strongest trade partner of Russia's principal trading region.
- China is the largest individual trade partner of Russia.
- The oil trade of Russia has shifted towards China and India.
Conclusion
The Russian authorities have been a significant participant in the global trade market because of the effective trade of mineral wealth, agricultural capacity, industrial base, and strategic geographical location. The trade environment has led to a considerable upgrade of the nation. The latest customs statistics will support international trade while maintaining a major role in the global marketplace. The trade structure is increasingly oriented towards Turkey, Kazakhstan, China, and India.
Energy products will dominate the export of the nation, while machinery, electronics, and vehicles will be important for the import categories. The Russia Customs Data will provide valuable commercial intelligence to businesses to help organizations identify potential buyers. The understanding of the sourcing patterns will evaluate the international market opportunities. The Russia trade corridor will promote intelligence while maintaining the increasing importance of the nation to understand the changing supply chain.
CTA
Looking for an expansion in your trade market in Russia, you have landed at the right platform here. Russia Shipment Data helps the authorities get detailed information regarding buyers and suppliers. The comprehensive customs database helps the authorities cover importer name, exporter name, and HS code with Russia Import Export Data. Subscribe to www.importglobals.com or drop an email at info@importglobals.com to get a detailed analysis of the Russia Trade Data to accelerate your global business growth.
FAQs
Que. What is the total foreign trade turnover of Russia in 2025?
Ans. The total foreign trade turnover of Russia in 2025 is 697.3 billion US dollars.
Que. What is the export trade value of Russia in 2025?
Ans. The export trade value of Russia in 2025 is 418 billion US dollars.
Que. What is the import trade value of Russia in 2025?
Ans. The import trade value of Russia in 2025 is 281 billion US dollars.
Que. Name the top products imported by Russia in 2025.
Ans. Machinery, electrical equipment, vehicles, and electronic products are the top variants imported by Russia in 2025.
Que. What are the top exported products of Russia in 2025?
Ans. Crude petroleum, petroleum products, and natural gas are the top exported products of Russia in 2025.
Que. Name the top trading partner of Russia in 2025.
Ans. China is the top trade partner of Russia in 2025.
Que. Why Russia customs data and Russia trade data beneficial for service expansion?
Ans. Russia customs data and Russia trade data are beneficial for service expansion because they help the authorities study shipment patterns.
Que. How does Russia import-export data support business growth?
Ans. Russia import-export data supports business growth via proper identification of buyers, supplier analysis, analysis of market demand, and development of effective market expansion strategies.
Que. What details are included in the Russia customs data?
Ans. Russia customs data covers Importer names, Exporter names, Shipment date, HS Code, Product Details, quantity, values, pricing information, origin country, importing country & port details.
Que. How frequently is the Russia trade data updated?
Ans. Russia trade data is updated on a monthly basis.
Que. Where can I get detailed access to the Russia trade data?
Ans. Visit www.importglobals.com or drop an email at info@importglobals.com for detailed updates on the Russia trade data.
You Can Also Visit :-
- Russia Export Data: An Overview of the Products Traded and the Global Market Role of the Country
- The Impact of Russia's Fuel Supply Challenges on Reshaping Import and Export Trade: The Market Insights, and the Future Business Outlook
- Russia Top Exporting Product Of 2023-2024
- Introduction to the Fossil Fuels Export Market of Russia
- Information About Russia's Oil Exports, Such as How Much Oil Russia Makes and WHO Sells It