Transatlantic Trade Tensions (U.S. Vs. EU): The Comprehensive Trade Overview
- Oct 08, 2026
- 129 Views
Transatlantic Trade Tensions (U.S. Vs. EU): The Comprehensive Trade Overview
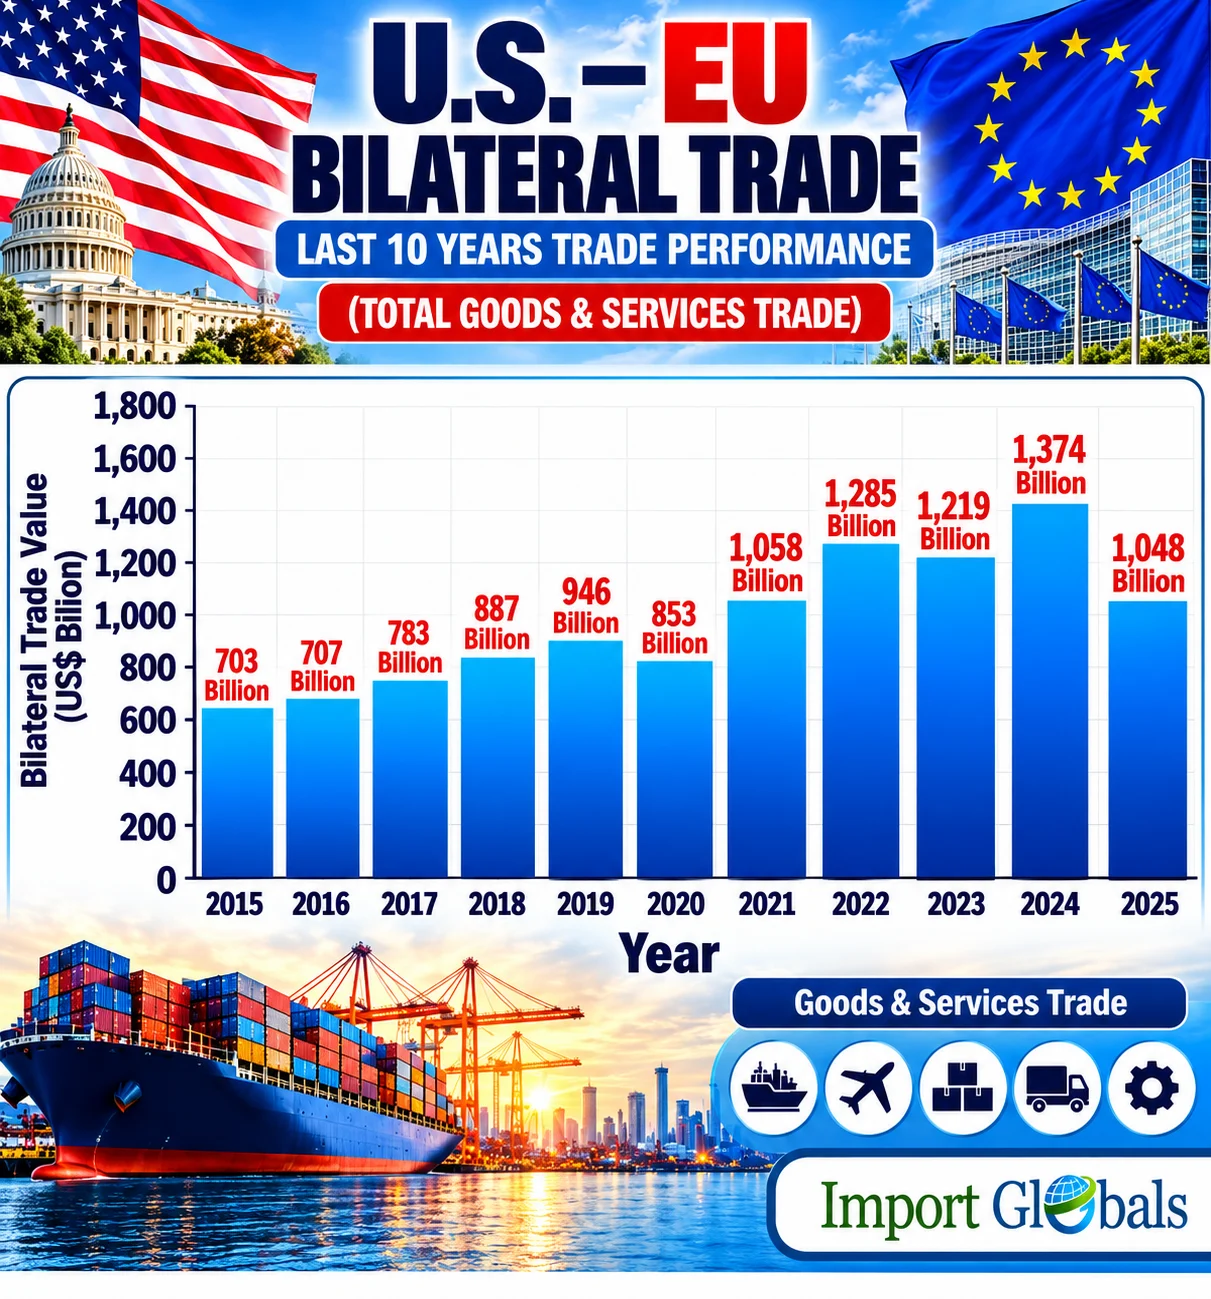
The US and the EU continue to be one another’s closest partners economically, even if the trade debate becomes more contentious. Good trade figures for the US and the EU reached a historic high of $1.05 trillion, with the US exporting goods totalling $414 billion and importing $633 billion from the EU (a trade deficit of $219 billion), as per US Shipments Data. Despite the higher tariffs in 2025; the trade deficit was 7% lower than in 2024 ($236 billion). The goods and services trade figures show the US performing better.
In services trade, the US exported $325 billion and imported $256 billion in services from the EU. In overall terms, the aggregate US trade deficit with the EU would come to about $150 billion, with the total value of goods and services exchanged reaching a historic high of $1.63 trillion. It is important to note that the trade relationship goes way beyond plain trade. Intra-company sales made by US companies in Europe ($3.9 trillion) and by European companies in the US ($3.5 trillion) dramatically exceed direct exports between the two parties. This proves that competition for supplies of steel, aluminum, eco-friendly energy, and the issue of overcapacity do happen within an economy that is highly interdependent, as per EU Shipments Data.
US vs EU: The Latest Trade Insights Overview
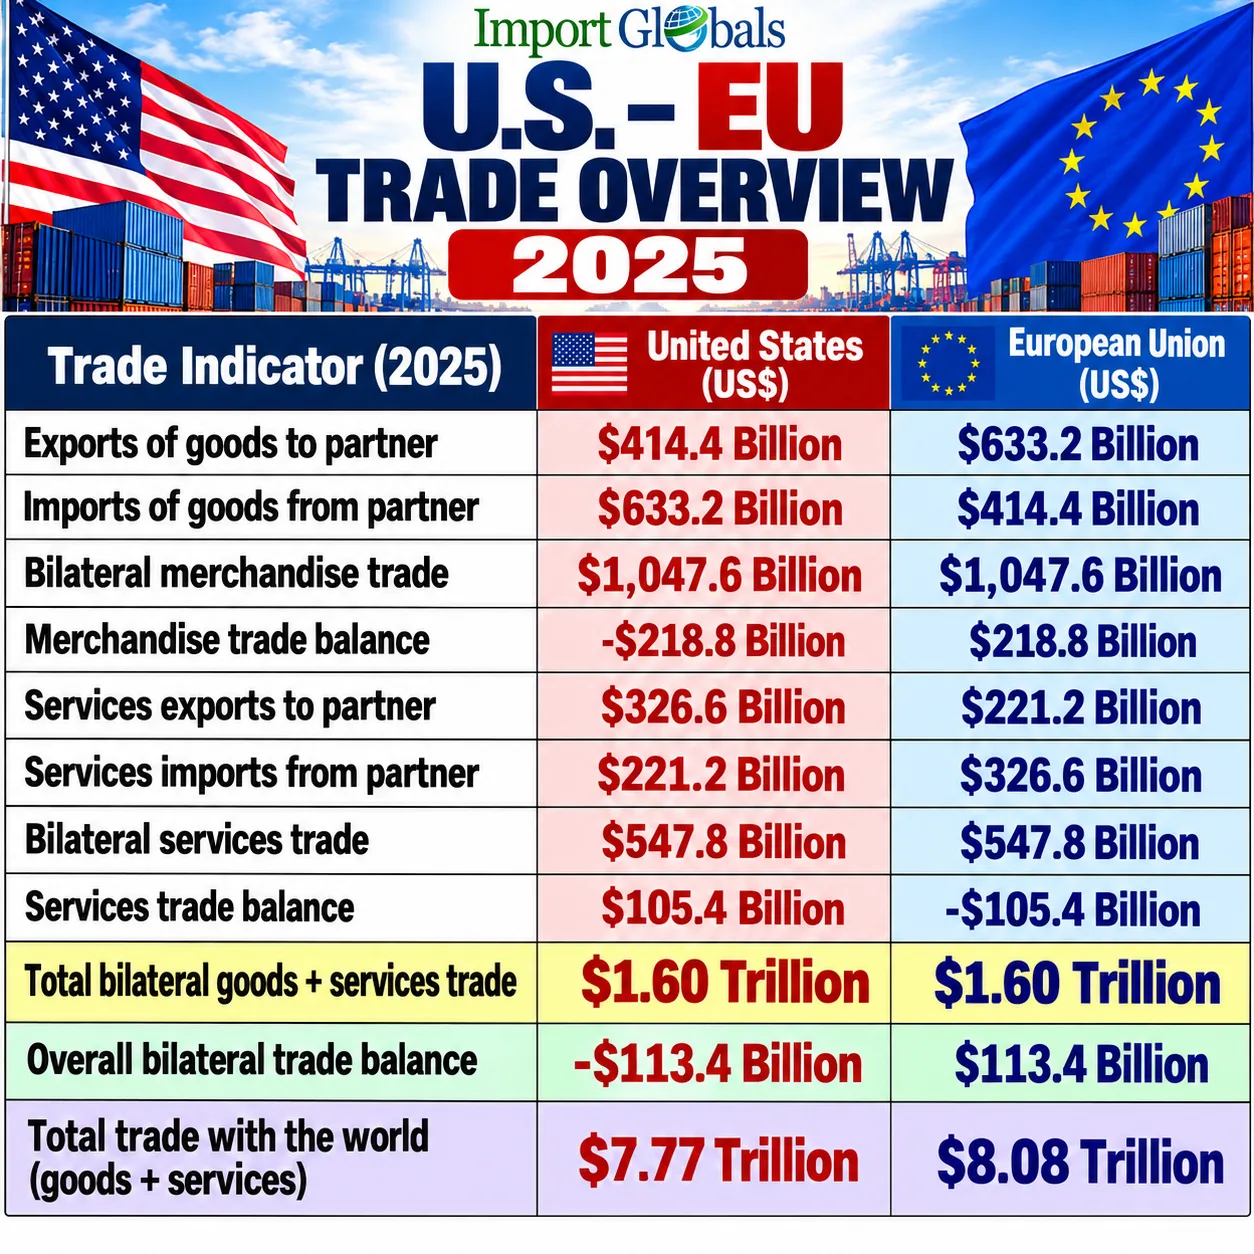
In 2025, the United States and European Union continued their relationship as crucial partners in trade, as the total volume of goods and services traded was close to $1.60 trillion. The merchandise trade between the two sides consisted of $414.4 billion worth of exports from the U.S. to the EU and $633.2 billion worth of imports from the EU. As a result, the total merchandise trade between the two parties totalled $1,047.6 billion and resulted in the goods trade deficit of the U.S in the amount of $218.8 billion, which corresponds to the surplus of the EU in the same amount.
The services trade is the opposite of that. It accounted for $326.6 billion worth of services exported from the U.S. against $221.2 billion worth of imports, which means that the total US-EU services trade was $547.8 billion and the U.S. surplus equalled $105.4 billion. Thus, because of the surplus in the service sector, the deficit of U.S. goods trade is reduced from $218.8 billion to $113.4 billion, reported US Import Data. The economic relationship has a significant impact on world trade since $7.77 trillion of total trade was conducted from the U.S. to other countries and $8.08 trillion was accounted for by the EU. These numbers indicate an economy that is highly interdependent but also quite structurally unbalanced. Therefore, conflicts over tariffs, steel, subsidies, and industrial capacity are of very high importance for both sides.
Top Traded Goods of US in 2025
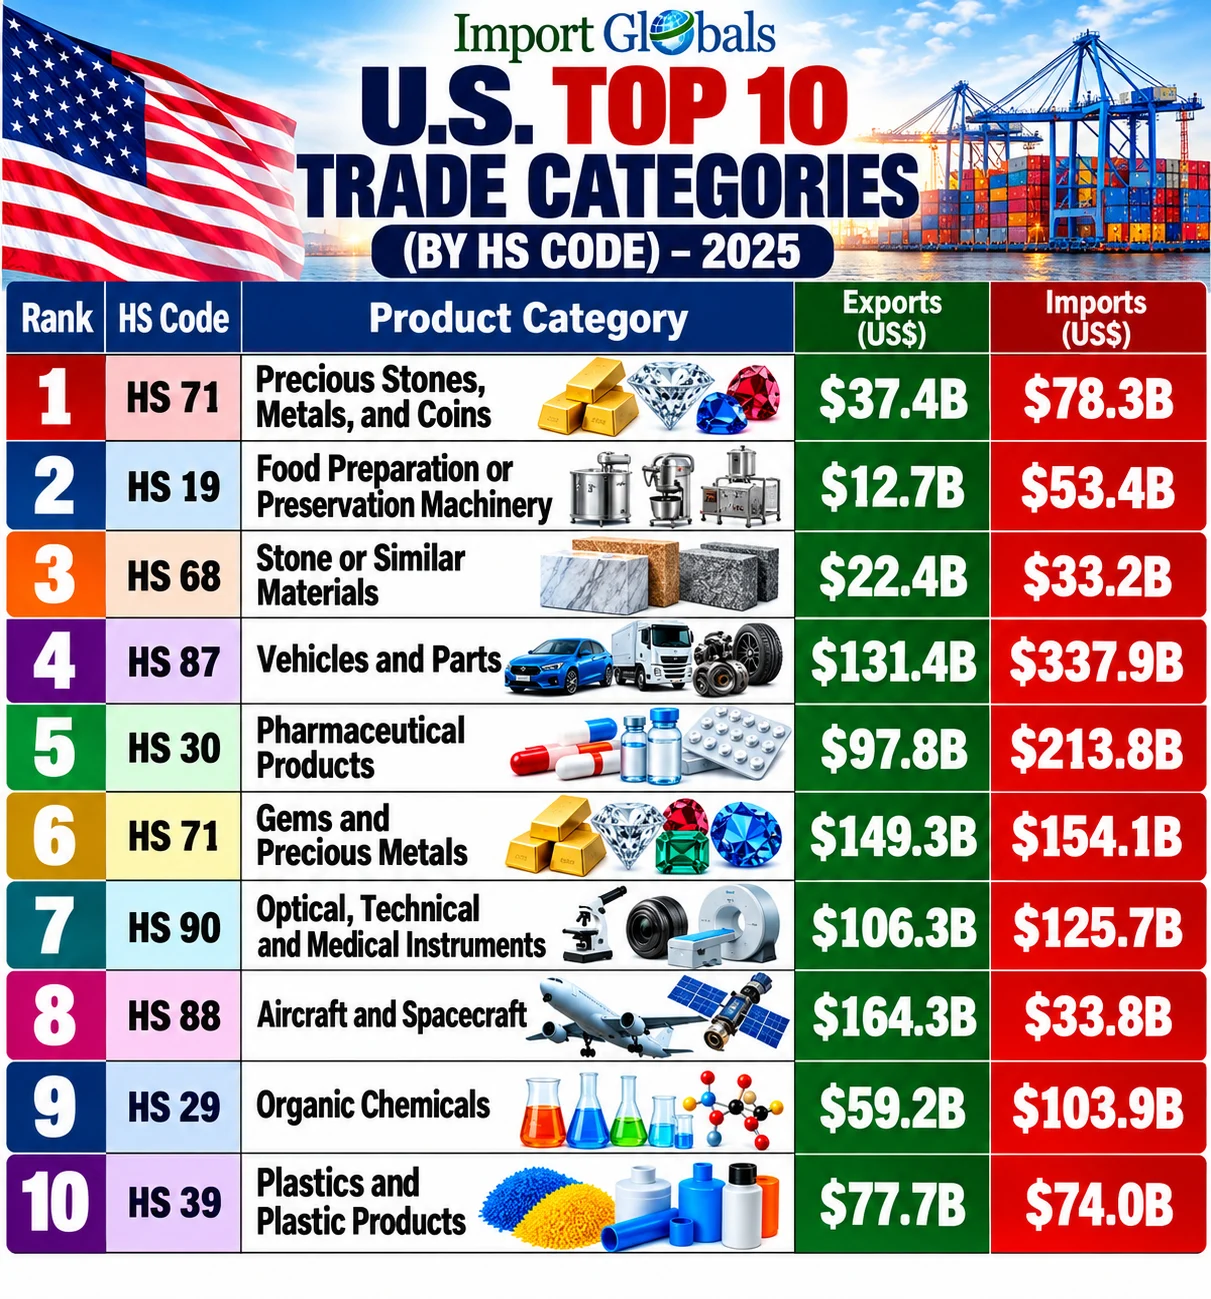
- HS 71: Precious Stones, Metals, and Coins | Exports: $37.4B | Imports: $78.3B
The gemstones and gold jewelry category is a key part of international trade for the U.S. that generates a deficit of nearly $41 billion, making it significantly more tactful to look at precious stones and jewelry, reported US Export Data.
- HS 19: Food Preparation or Preservation Machinery | Exports: $12.7B | Imports: $53.4B
This category is most profitable for U.S. businesses as it comprises all food preparation machinery for various industries. Robots represent over half of this industry’s exports, with total exports reaching almost $39 billion.
- HS 68: Stone or Similar Materials | Exports: $22.4B | Imports: $33.2B
U.S. imports of construction materials are a bit more than 50% of U.S. exports in the same category; however, both exports and imports have been on a downward trend for a number of years, reported US Export Trade Data.
- HS 87: Vehicles and Parts | Exports: $131.4B | Imports: $337.9B
Vehicle imports, including cars, parts, and trucks; went down by 13.7% in 2025, resulting in a trade deficit of $206.5 billion. Cars alone represented $183.8 billion of imports against $57.3 billion of exports. Nevertheless, automobile parts exports increased by an impressive 20.8% each year.
- HS 30: Pharmaceutical Products | Exports: $97.8B | Imports: $213.8B
A hefty amount of pharmaceuticals are imported. The trade records $213.8 billion of imports versus $97.8 billion of exports, leaving a gap of $116 billion. The largest amounts raised in trade were related to blood and serum fractions ($109.6 billion of imports and $61.2 billion of exports) and very little to dosage forms of medicines ($94.1 billion and $35.8 billion, respectively).
- HS 71: Gems and Precious Metals | Exports: $149.3B | Imports: $154.1B
The main reason for the growth is gold. The export of gemstones and precious metals increased by 102.4% to $149.3 billion, while imports rose by 71.8% to $154.1 billion, which made the trade balance practically zero. The sales of unwrought gold account for $81.9 billion of exports and $30.2 billion of imports, reported US Trade Statistics.
- HS 90: Optical, Technical and Medical Instruments | Exports: $106.3B | Imports: $125.7
The trade of optical, technical, and medical instruments goes both ways. The imports totalled $125.7 billion, while exports reached $106.3 billion, thus resulting in a small gap.
- HS 88: Aircraft and Spacecraft | Exports: $164.3 billion | Imports: $33.8 Billion
Aerospace is the largest net export of the United States, as the figures show $164.3 billion worth of products exported abroad and $33.8 billion worth imported by the country, resulting in a surplus of $130.5 billion. Exports saw growth of 22.4% in 2025, indicating the excellent international competitive position of U.S. manufacturers and suppliers of aircraft and spacecraft.
- HS 29: Organic Chemicals | Exports: $59.2 billion | Imports: $103.9 Billion
A massive increase of 46.2% was registered in the import of organic chemicals, which reached the level of $103.9 billion, while exports of organic chemicals reached $59.2 billion (14.1% growth), which resulted in the widening of the deficit by $44.7 billion. The greatest increase was demonstrated by hormones and various steroids, which recorded an increase in imports of 224.2% and amounted to approximately $58.6 billion.
- HS 39: Plastics and Plastic Products | Exports: $77.7 billion | Imports: $74.0 Billion
Export and import operations in the field of plastics are balanced ($77.7 billion of exports versus $74 billion of imports, resulting in a surplus of $3.7 billion). Exports of polymers of ethylene reached $17.5 billion, which is a decrease of 17.5% as compared to the year 2024. This is one of three surplus categories of the United States mentioned in this report.
Top 10 Traded Goods of EU in 2025
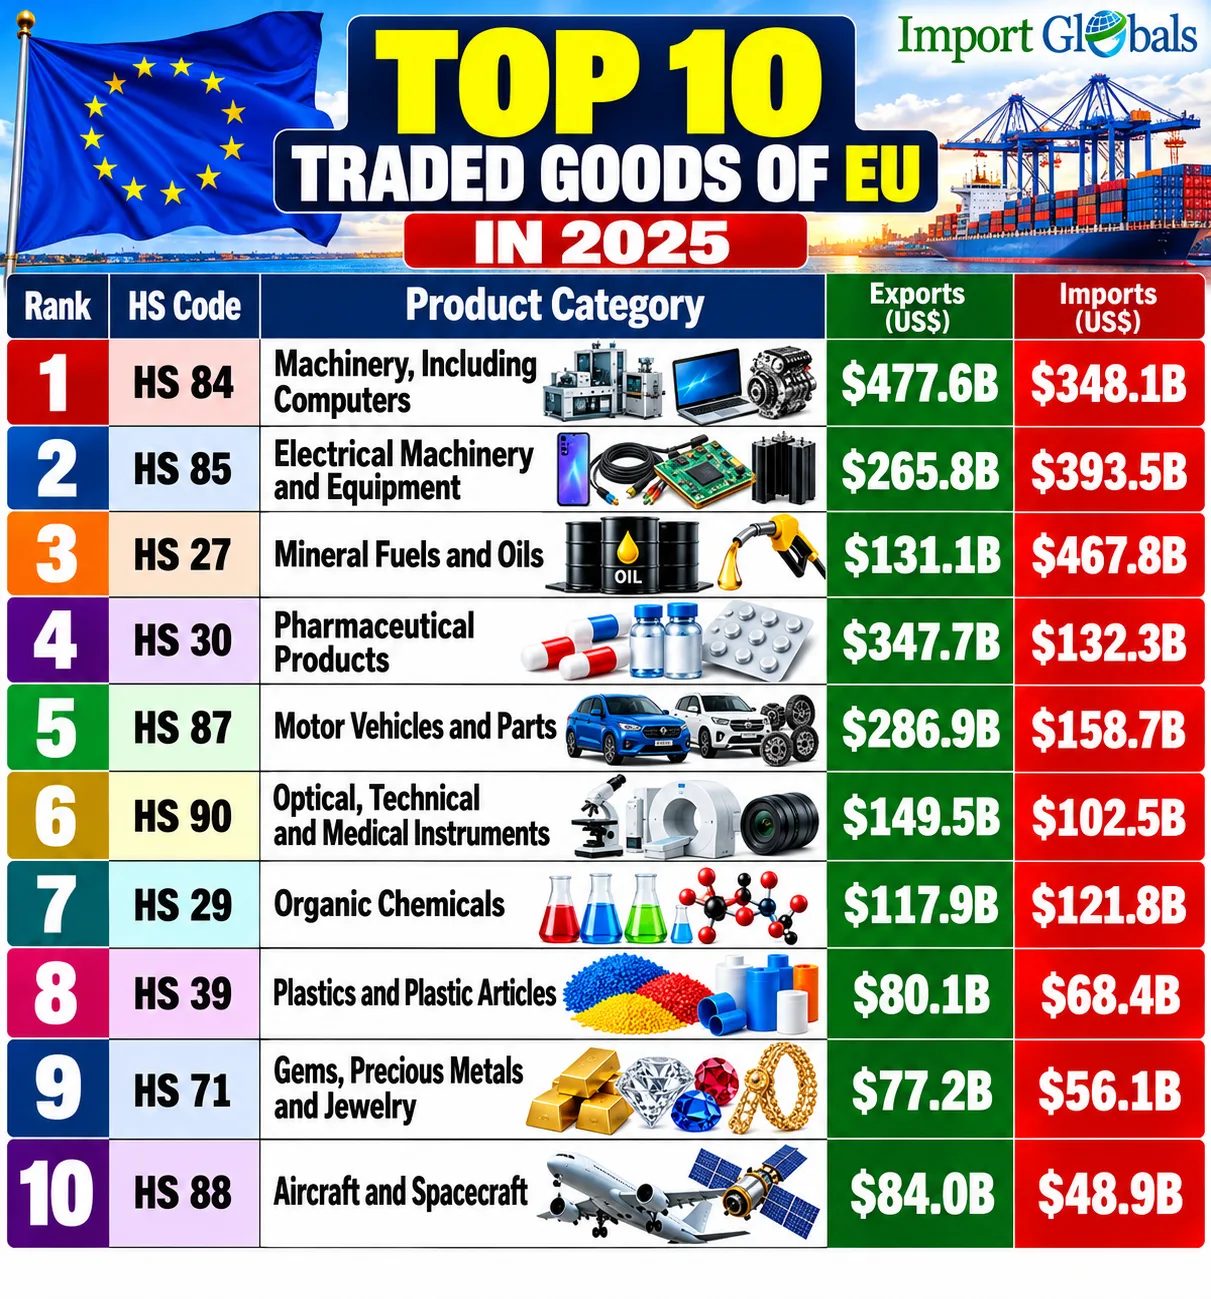
- HS 84: Machinery, Including Computers | Exports: $477.6B | Imports: $348.1B
The largest category of EU trade is machinery, with a surplus of $129.6 billion. The EU member states export industrial machinery, engines, and pumps while importing computers and machinery. China accounts for $120.3 billion of the EU’s machinery imports, and the US for $64.6 billion, reported EU Import Export Data.
- HS 85: Electrical Machinery and Equipment | Exports: $265.8B | Imports: $393.5B
A deficit category with imports exceeding exports by a whopping $127.7 billion, electrical machinery includes telephones, circuits, batteries, and wires among its imports, with imports at $393.5 billion and exports at $265.8 billion. China accounts for $186.3 billion in imports, while the US contributes only $20.4 billion.
- HS 27: Mineral Fuels and Oils | Exports: $131.1B | Imports: $467.8B
This is the largest deficit category at the EU level: the difference between imports and exports amounting to $336.7 billion. The category mainly comprises crude oil, natural gas, and different kinds of refined fuels. The biggest exporter of this category is the US with $79.7 billion.
- HS 30: Pharmaceutical Products | Exports: $347.7 B | Imports: $132.3 B
EU’s highest surplus category sits at $215.4 billion: exports of $347.7 billion surpass imports by 2.6 times ($132.3 billion). Pharmaceutical products, vaccines, and blood-based products are the driving force behind these exports, while the United States made up $49.3B of the EU imports.
- HS 87: Motor Vehicles and Parts | Exports: $286.9 B | Imports: $158.7B
Automobiles gave rise to an additional $128.1 billion in surplus, registering exports of $286.9 billion with only $158.7 billion of imports. The EU’s automotive exports to the US dropped sharply in 2025 by 20.4%, while vehicles from the US only accounted for $11.9 billion of EU imports.
- HS 90: Optical, Technical and Medical Instruments | Exports: $149.5 B | Imports: $102.5 B
The category of precision instruments produced a $47 billion surplus by registering $149.5 billion in exports and $102.5 billion in imports. This category includes medical, surgical, optical, and measuring instruments. The US was responsible for $31.6 billion of EU imports, marking the fourth largest category.
- HS 29: Organic Chemicals | Exports: $117.9 B | Imports: $121.8 B
Organic Chemicals stand almost at a balance; with imports exceeding exports by $4 billion at $121.8 billion. This category feeds into pharmaceutical and industrial supply chains. Of this amount, China accounted for $38.5 billion of EU imports, while the US accounted for $28.7 billion worth of imports, says EU Trade Statistics.
- HS 39: Plastics and Plastic Articles | Exports: $80.1B | Imports: $68.4B
Plastics trade is observed to be moderately in surplus; with exports of $80.1 billion being higher than imports of $68.4 billion, with a surplus of $11.7 billion. Components like resins, films, tubes, and packaging play a big role in the total turnover. Among the suppliers of EU plastics imports; China provided $17.8 billion and the U.S. $10.7 billion.
- HS 71: Gems, Precious Metals and Jewelry | Exports: $77.2B | Imports: $56.1B
Gems and precious metals create a surplus of $21.1 billion, with exports at $77.2 billion and imports at $56.1 billion. The chapter contains gold, silver, pearls, diamonds; and jewelry. Among the imports from the U.S., the value was only $6.3 billion in 2025.
- HS 88: Aircraft and Spacecraft | Exports: $84.0B | Imports: $48.9B
Aircraft and spacecraft bring around $35.1 billion of surplus, with exports amounting to $84.0 billion and imports of $48.9 billion. The U.S. proved to be the supplier of $26.4 billion, accounting for more than half of the total imports in this category, making it the most dependent of all ten categories.
Bilateral Trade Insights of US and EU: Past 10 Years
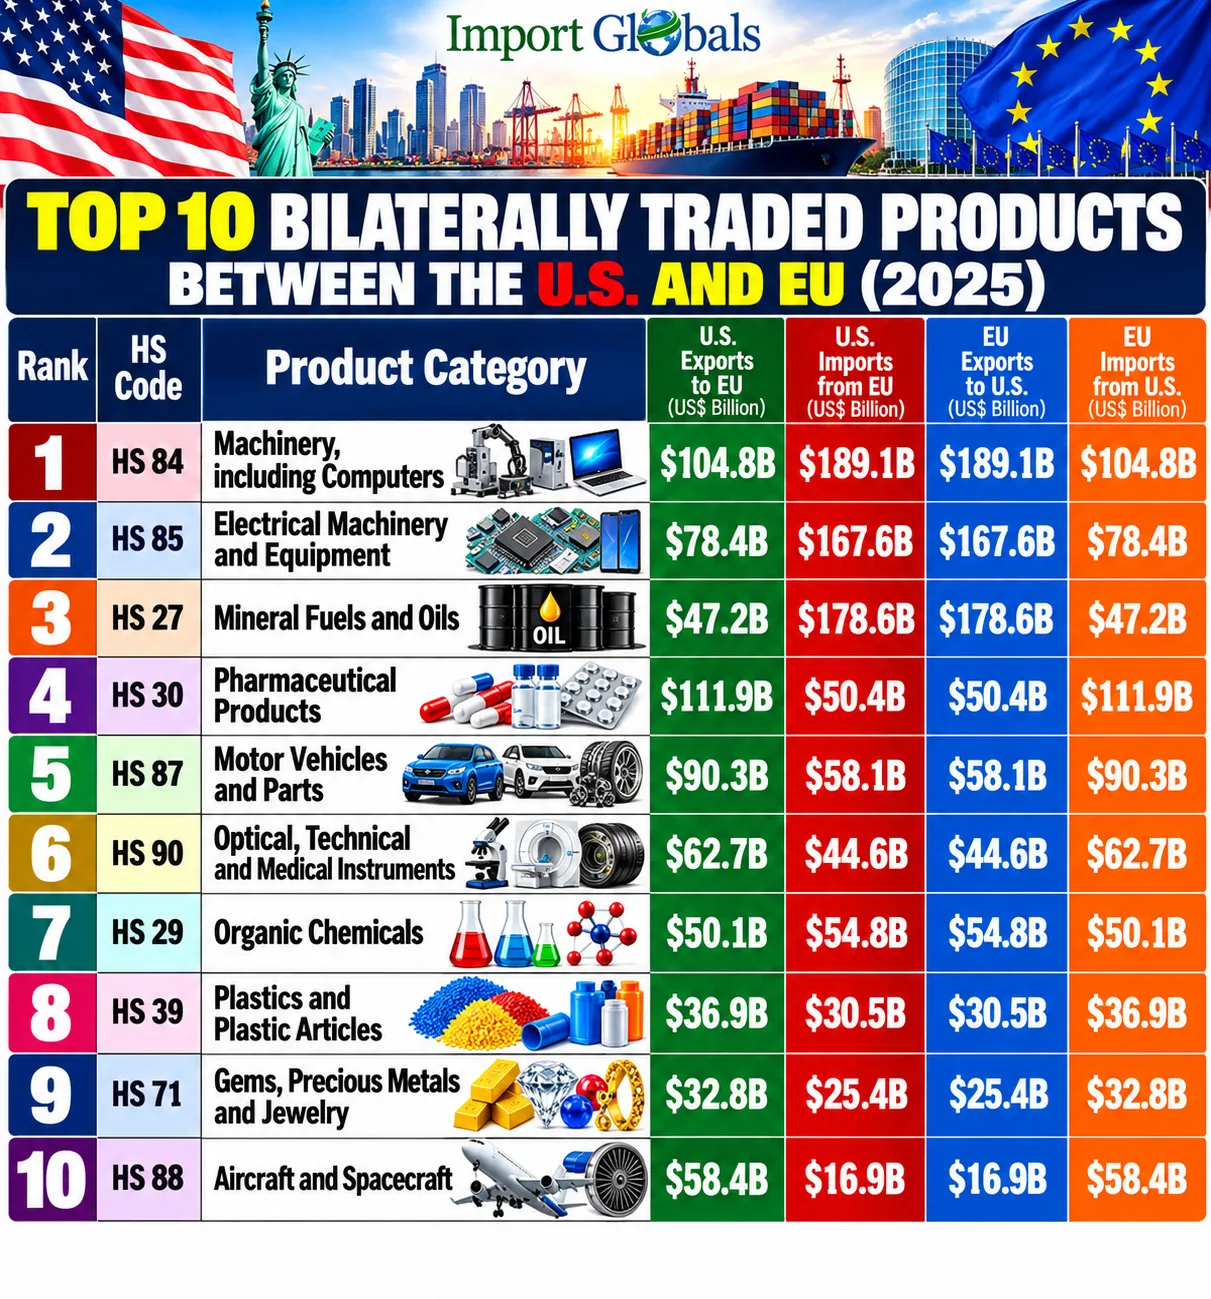
European Export Dynamics: Pharmaceuticals, Machinery and Vehicles
- Pharmaceuticals are the Dominant Category of Exports - In 2025, the EU exported $347.7 billion (HS 30) in pharmaceutical products, having also imported only $132.3 billion, resulting in a $215.4 billion surplus, which is the highest among all categories. Exports are driven by medicines, vaccines, and blood products. The U.S. supplied the EU with $49.3 billion of pharmaceuticals. Pharmaceuticals are very interdependent.
- Machinery is the Largest Category by Volume - The exports of machinery (HS 84) reached $477.6 billion vs. imports of $348.1 billion, or a surplus of $129.6 billion. Europe exports industrial machinery, engines, and pumps while importing computers and equipment. China provided EU imports of machinery amounting to $120.3 billion, while the U.S. amounted to $64.6 billion.
- Vehicles are Strong but Vulnerable in the U.S. Market - Exports of vehicles and parts (HS 87) amounted to $286.9 billion while imports totalled $158.7 billion, hence the surplus of $128.1 billion. This is the category most affected by U.S. trade measures, since EU car exports dropped by 20.4 % in 2025, reported US Customs Data. At the same time, American car imports to Europe amounted only to $11.9 billion.
Top 3 Tariffs Shaping U.S. - EU Trade in 2025

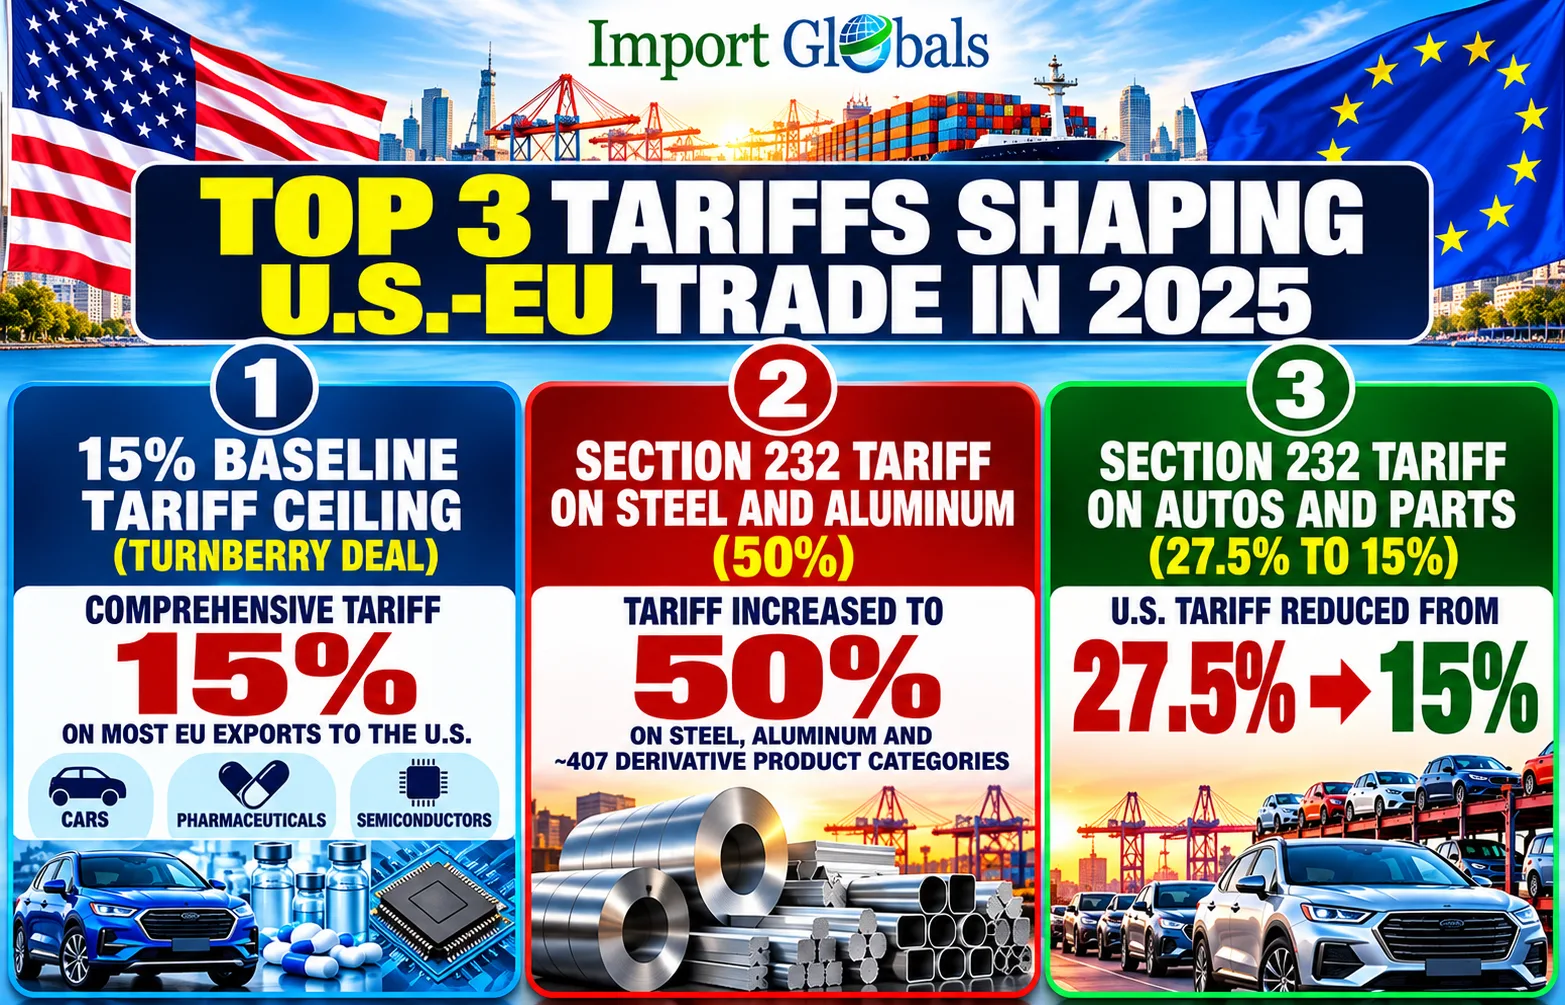
The future of trade between the United States and the European Union following the records achieved in 2025 will depend on the viability. The Turnberry agreement came into effect on July 1, 2026, limiting most U.S. tariffs on European goods, including cars, drugs, and semiconductors, to a flat 15% while the EU dropped tariffs on U.S. industrial goods. The agreement operates until the end of 2029; providing good predictability for businesses and investors, says US Import Export Data.
The main test of the agreement will take place at the end of 2026 when Brussels will be able to halt its program if American tariffs on steel and aluminum derivatives exceed 15%. Adding to the uncertainties around the deal are the legal issues: after the Supreme Court stopped 2025, the U.S. government started relying temporarily on tariffs, being set to start applying new duties under Section 301 (10% to 12.5 on many states) from July 24, 2026. In charge of the tariffs, the EU has lost its advantage over other trading partners; while weak U.S. tariffs could make further exports more difficult to realize.
Conclusion
The transatlantic economic connection in 2025 indicates a scenario where economies are interdependent but retain structural imbalances. The value of trade in goods reached a new high of $1.05 trillion, and trade in all goods and services amounted to $1.6 trillion despite the fact that an increase in tariffs has reduced the American trade deficit for goods by just 7% ($219 billion). The sectoral numbers tell a similar story on both sides, with Americans relying on imports of machinery, electronics, and drugs, while Europe is achieving the surplus with the help of the pharmaceutical business, machinery, and cars, but suffers from a large energy deficit. The changes in tariff rates have affected this balance while leaving it intact.
The 15% tariff ceiling has offered transparency for exporters in the rates that they face, but the areas of car trade, steel, and aluminum trade remain the most critical ones. All that said, car and parts exports from the EU to the U.S. dropped by 20.4%. On 31 December 2026, we will see if the vagueness with which steel and aluminum derivative tariffs are being handled can lead the EU to proceed with the suspension of its concessions owing to the unresolved tariffs imposed by the U.S. of 50%.
CTA
Looking for the latest trade insights in the US and EU to craft your marketing growth strategy? Then you have landed on the right platform. Import Globals provides detailed acknowledgements of the latest traded products within both countries to convert datasets into active trade assets. Subscribe to www.importglobals.com or drop an email at info@importglobals.com to drive your international business growth regarding the US and EU trade insights.
FAQ’s
Que. What is the overall dimension of the U.S.-EU trade in 2025?
Ans. The U.S.-EU trade in 2025 recorded a valuation of 1.05 trillion U.S. dollars, composed of 414 billion U.S. dollars of exports and 633 billion U.S. dollars of imports between the U.S. and the EU.
Que. What is the trade deficit of the U.S. with the European Union in 2025?
Ans. The trade deficit of the United States with the European Union in 2025 is 219 billion U.S. dollars.
Que. Are the higher tariffs reducing the trade gaps?
Ans. The higher tariffs have been slightly affecting the trade gaps within both regions.
Que. What is the Turnberry agreement?
Ans. The Turnberry agreement is the U.S.-EU trade deal; which captures most U.S. tariffs on EU goods, including cars, pharmaceuticals, and semiconductors, with a 15% baseline ceiling.
Que. Name the tariffs affecting the U.S.-EU trade in 2025.
Ans. The 15% baseline ceiling and the 15% Section 232 tariff on steel and aluminum have been affecting U.S.-EU trade the most in 2025.
Que. What are the top goods of U.S. trade?
Ans. Machinery and electrical equipment are the top goods in U.S. trade in 2025.
Que. How does U.S.-EU import-export data support business growth?
Ans. The U.S.-EU import-export data support business growth via proper identification of buyers, suppliers, analysis of market demand, and development of effective market expansion strategies.
Que. What information is available in U.S.-EU trade data?
Ans. U.S.-EU trade data covers importer name, exporter name, shipment date, HS code, product details, quantity, values, pricing, origin country, importing country, and port details.
Que. How frequently is the U.S.-EU trade data updated?
Ans. The U.S.-EU trade data is updated on a monthly basis.
Que. Where can one obtain detailed information on U.S.-EU trade data?
Ans. Visit www.importglobals.com or email info@importglobals.com for detailed updates on U.S.-EU trade data.
You Can Also Visit :-
- USA Import Data 2025: Latest Trade Statistics and Market Insights
- USA economic Data and Trade Analysis
- US Imports and Exports: Components and Statistics
- How the U.S. Will Stay the World's Biggest Trading Country in 2025
- The Export Market of the European Union in 2024: Brief Overview of the Major Exporters and Trading Partners
- EU-Philippines Trade Agreement: The Impact on Asian Supply Chains and World Commerce