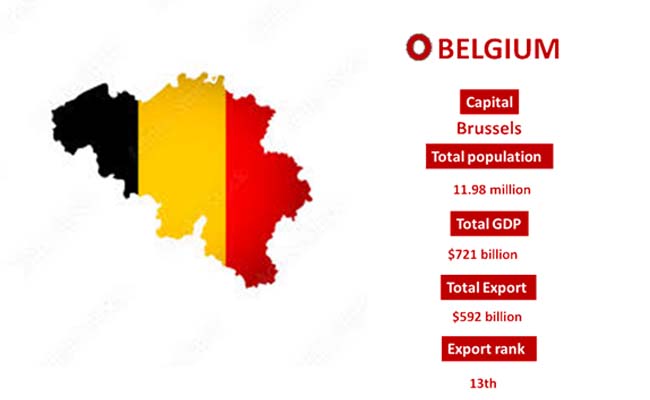
Belgium Export Data

Belgium Export Data

Belgium, a Western Europe country exported goods worth USD 42.2 billion in August 2021 as compared with previous month of USD 44.3 bn. This is as per the Belgium export data.

As per Belgium export trade data shows Belgium was 37th exporter country in the world during 2020. According to Belgium export custom data given Belgium’s population of 11.6 million people, value of Belgium’s exports in 2020 translated to roughly USD 36,200 for every resident in the west European country.

Why Choose Our Belgium Export Data

Our Belgium shipment data is useful to every business type; start-ups to big corporates and every industry –Logistics and Market Researchers. Here is a short view about our Export data of Belgium:

Data Available Till date

100% Coverage Trade Activity

Monthly Update Time

Sea, Air & Road Shipments Covered

100% Data Authenticity

Data Available on 2, 4, 6 & 8 digit Level HS Code

Historical Data Available Since 2010

Discover High Growth

Discover High Volume

Belgium Export Custom Statistics Data Shows Top 10 Importing Products In 2020 – Analysis By Chapter

  • 15.4% for Chapter 30 - Pharmaceutical products value of 45 billion US$
  • 11.8% for Chapter 87 - Vehicles other than railway or tramway rolling stock, and parts and accessories thereof value of 35 billion US$
  • 7.22% for Chapter 84 - Nuclear reactors, boilers, machinery and mechanical appliances; parts thereof value of 21 billion US$
  • 6.93% for Chapter 29 - Organic chemicals value of 20 billion US$
  • 6.02% for Chapter 39 - Plastics and articles thereof value of 17.8 billion US$
  • 5.22% for Chapter 71 - Natural or cultured pearls, precious or semi-precious stones, precious metals, metals clad with precious metal and articles thereof; imitation jewelry; coin value of 15.4 billion US$
  • 5.02% for Chapter 27 - Mineral fuels, mineral oils and products of their distillation; bituminous substances; mineral waxes value of 14.8 billion US$
  • 3.73% for Chapter 72 - Iron and steel value of 11 billion US$
  • 3.62% for Chapter 85 - Electrical machinery and equipment and parts thereof; sound recorders and reproducers, television image and sound recorders and reproducers, and parts and accessories of such articles value of 10.7 billion US$
  • 2.85% for Chapter 90 - Optical, photographic, cinematographic, measuring, checking, precision, medical or surgical instruments and apparatus; parts and accessories thereof value of 8.46 billion US$
  • 3.62% for Chapter 85 - Electrical machinery and equipment and parts thereof; sound recorders and reproducers, television image and sound recorders and reproducers, and parts and accessories of such articles value of 10.7 billion US$

Belgium Export Custom Trade Data Shows Top 10
Trading Partners
of Belgium

  • Germany with a share of 16.5% (49 billion US$)
  • France with a share of 13.3% (39 billion US$)
  • Netherlands with a share of 11.6% (34 billion US$)
  • USA with a share of 8.76% (25 billion US$)
  • United Kingdom with a share of 5.98% (17.7 billion US$)
  • Italy with a share of 4.79% (14.1 billion US$)
  • Spain with a share of 2.81% (8.33 billion US$)
  • China with a share of 2.57% (7.62 billion US$)
  • Poland with a share of 2.35% (6.96 billion US$)
  • Luxembourg with a share of 1.92% (5.68 billion US$)

What our Belgium Export Data contains

Belgium export trade statistics data is a kind of Statistical data used for primary research of the market. Belgium export trade data is calculated on shipping bills, import bills, invoices, and other export documents. It contains Year, Month, HS Code, Product Description, Quantity, Destination Country & Values Information. It gives a bird’s eye view of the country’s export business.

Export

Ask for Belgium Export Sample Data and Demo

TOP