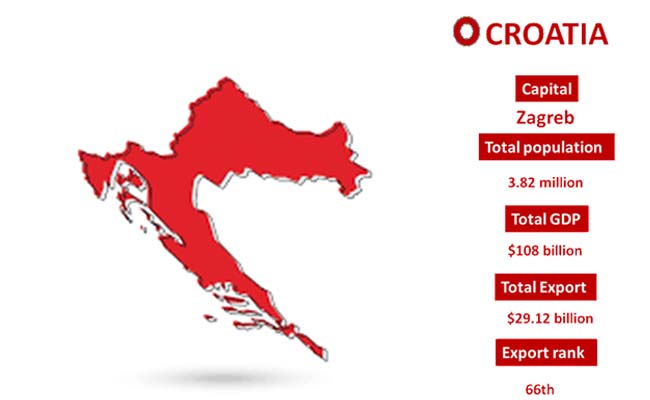
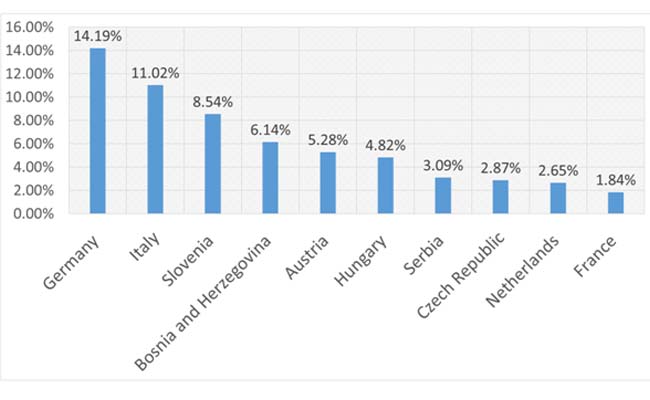
Croatia, with its footprint in south eastern Europe, extending up to Slovenia and Hungary in the northwest and northeast direction, has expanded its export market reach, backed up by the reliable access to the Adriatic Sea and the strong road and motorway infrastructure. Croatia Export Data represented the stronger access of the country to major European buyers like Germany, Italy, and Slovenia, along with the increased infrastructure resilience as the factors supporting the trade revenue.
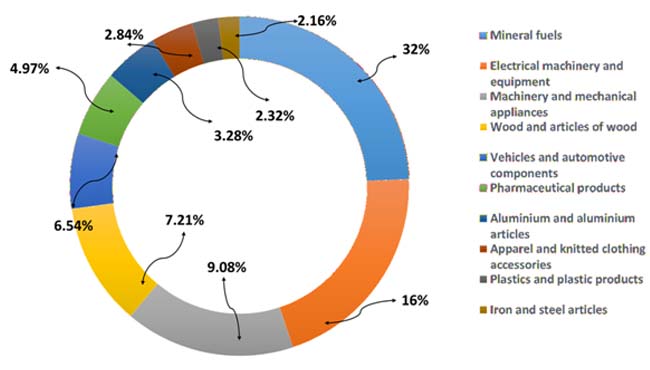
The export portfolio of the nation is mainly based on the trade of machinery, electrical equipment, pharmaceuticals, and refined petroleum products. Croatia Trade Data listed the nominal export ranking at 66th on a global scale, with a total annual valuation of exports worth $29.12 billion in 2025.