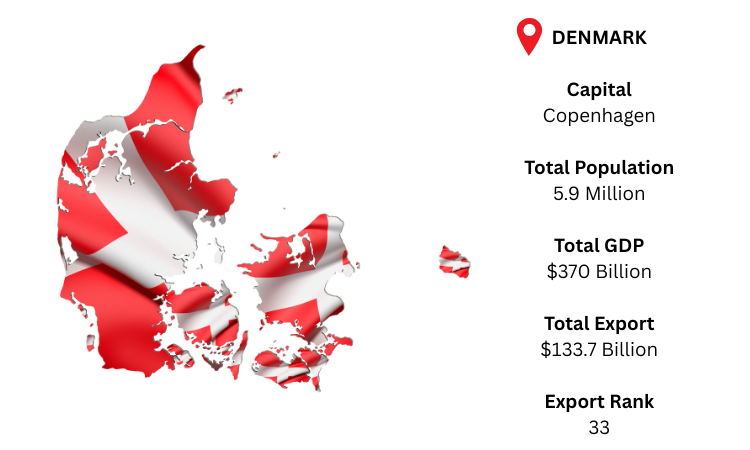
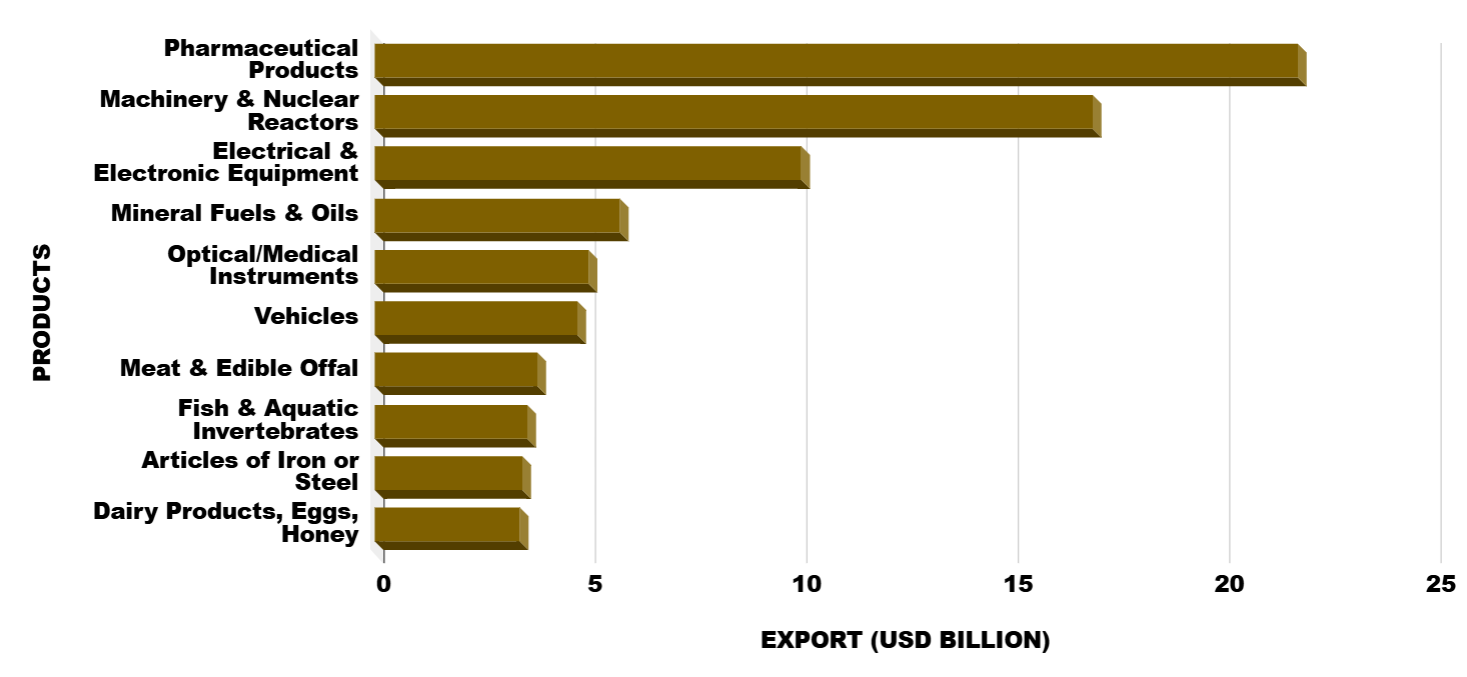
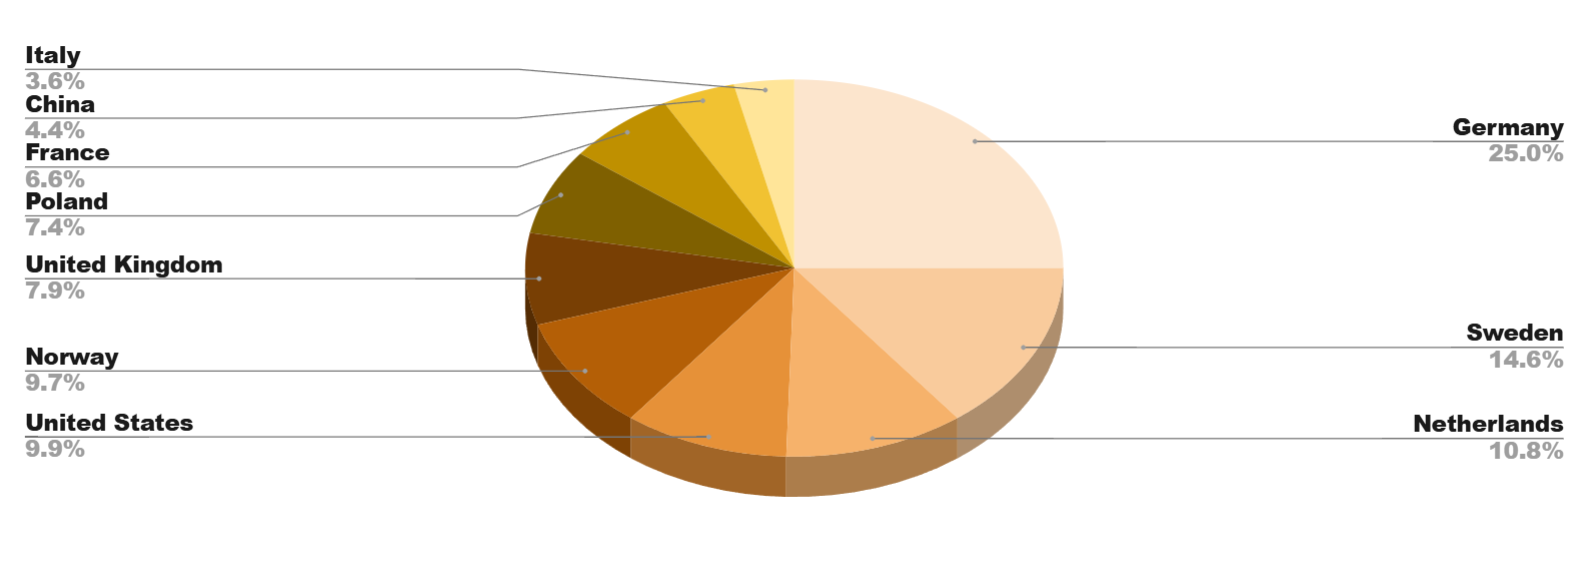
Denmark Export Data

Denmark Export Data

Denmark is a country in European continent. As per Denmark export data, the country’s exports valued USD 108.2 billion in 2020. The value of merchandise exports from Denmark totalled $ 107 billion in 2020. As per Denmark export trade data overall commodity exports from Denmark decreased by 2.51% compared to 2019. Merchandise exports decreased by $ 2.76 billion the value of merchandise exports from Denmark amounted to $109 billion in 2019.

As per Denmark export custom data shows Denmark was 28th exporter country in the world during 2020. Given the population of Denmark were 10.7 million people in 2020. Therefore, its value of total exports in 2020 translated to roughly USD 17,900 for every resident in the central European country.

Why Choose Our Denmark Export Data

Our Denmark shipment data is useful to every business type; start-ups to big corporates and every industry –Logistics and Market Researchers. Here is a short view about our Export data of Denmark:

Data Available Till date

100% Coverage Trade Activity

Monthly Update Time

Sea, Air & Road Shipments Covered

100% Data Authenticity

Data Available on 2, 4, 6 & 8 digit Level HS Code

Historical Data Available Since 2010

Discover High Growth

Discover High Volume

Denmark Export Custom Statistics Data Shows Top 10 Importing Products In 2020 – Analysis By Chapter

  • 17.7% for Chapter 30 - Pharmaceutical products value of 19 billion US$
  • 13.2% for Chapter 84 - Nuclear reactors, boilers, machinery and mechanical appliances; parts thereof value of 14.1 billion US$
  • 7.92% for Chapter 85 - Electrical machinery and equipment and parts thereof; sound recorders and reproducers, television image and sound recorders and reproducers, and parts and accessories of such articles value of 8.49 billion US$
  • 3.88% for Chapter 90 - Optical, photographic, cinematographic, measuring, checking, precision, medical or surgical instruments and apparatus; parts and accessories thereof value of 4.16 billion US$
  • 3.84% for Chapter 02 - Meat and edible meat offal value of 4.11 billion US$
  • 2.94% for Chapter 94 - Furniture; bedding, mattresses, mattress supports, cushions and similar stuffed furnishings; lamps and lighting fittings, not elsewhere specified or included; illuminated sign illuminated nameplates and the like; prefabricated build
  • 2.83% for Chapter 87 - Vehicles other than railway or tramway rolling stock, and parts and accessories thereof value of 3.03 billion US$
  • 2.65% for Chapter 03 - Fish and crustaceans, molluscs and other aquatic invertebrates value of 2.85 billion US$
  • 2.61% for Chapter 27 - Mineral fuels, mineral oils and products of their distillation; bituminous substances; mineral waxes value of 2.8 billion US$
  • 2.59% for Chapter 39 - Plastics and articles thereof value of 2.78 billion US$

Denmark Export Custom Trade Data Shows Top 10
Trading Partners
of Denmark

  • Germany with a share of 12.6% (13.5 billion US$)
  • Sweden with a share of 8.71% (9.34 billion US$)
  • Netherlands with a share of 5.77% (6.18 billion US$)
  • Norway with a share of 5.74% (6.16 billion US$)
  • United Kingdom with a share of 4.64% (4.97 billion US$)
  • USA with a share of 4.59% (4.93 billion US$)
  • China with a share of 4.04% (4.33 billion US$)
  • Poland with a share of 3.45% (3.7 billion US$)
  • France with a share of 2.87% (3.08 billion US$)

What our Denmark Export Data contains

Denmark export statistics data is a kind of Statistical data used for primary research of the market.  Denmark export trade statistics data is calculated on shipping bills, export bills, invoices, and other export documents. It contains Year, Month, HS Code, Product Description, Quantity, Destination Country & Values Information. It gives a bird’s eye view of the country’s export business.

Export

Ask for Denmark Export Sample Data and Demo

TOP