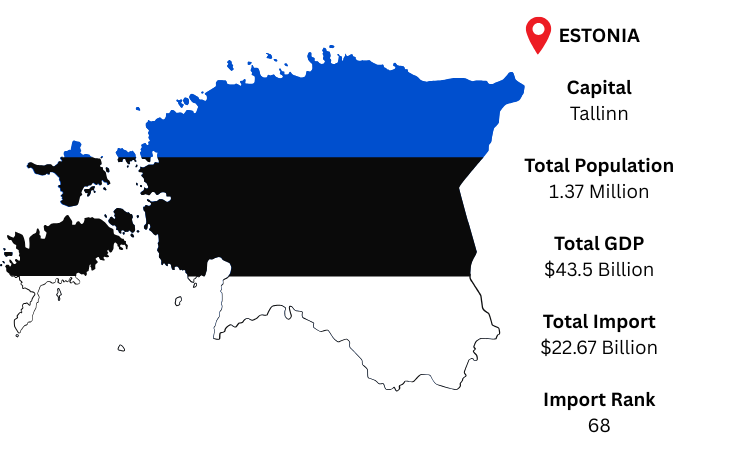
With a contemporary economy focused on ICT, industrial products, and commerce, Estonia is a Baltic state that prioritizes digitalization. The capital, the center of government and business, is Tallinn. As per Estonia import data, with a GDP of around USD 43.5 billion and a population of approximately 1.37 million, Estonia's total imports in 2024 totaled USD 22.67 billion, primarily financed by regional partners.
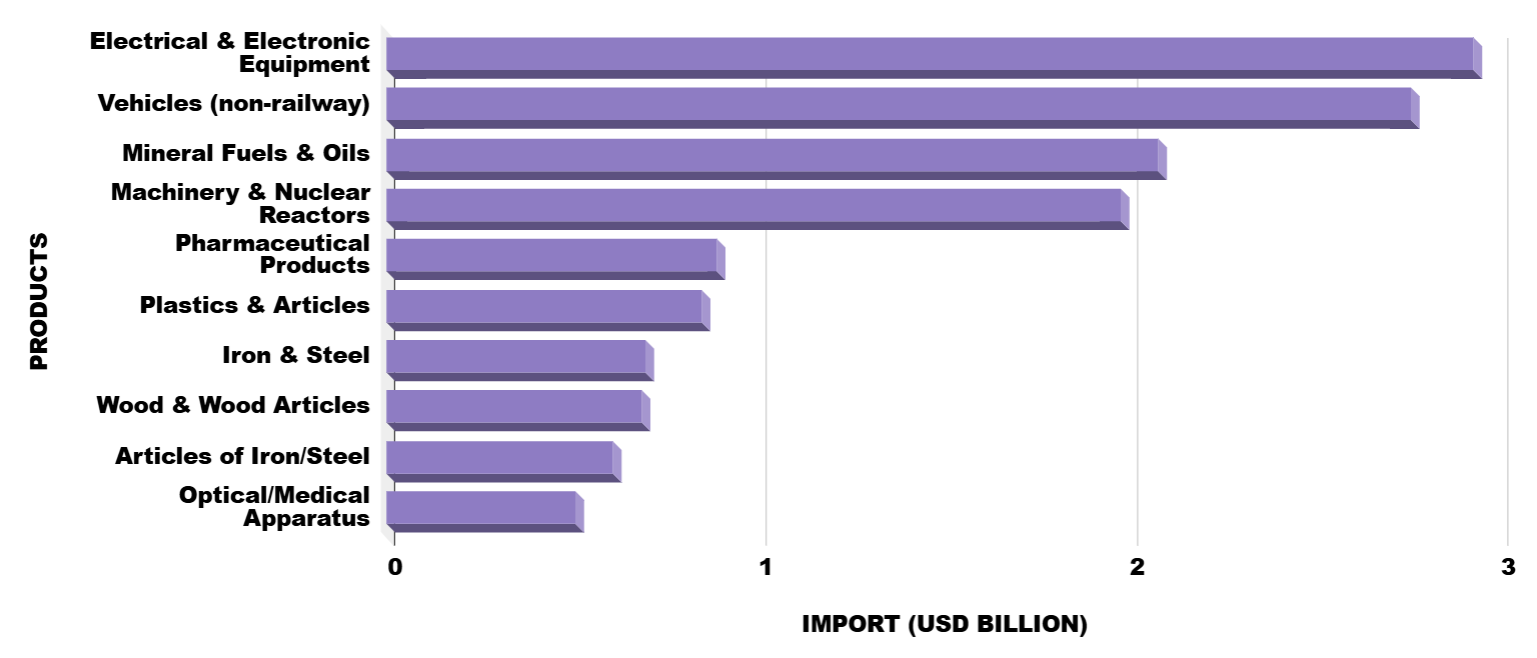
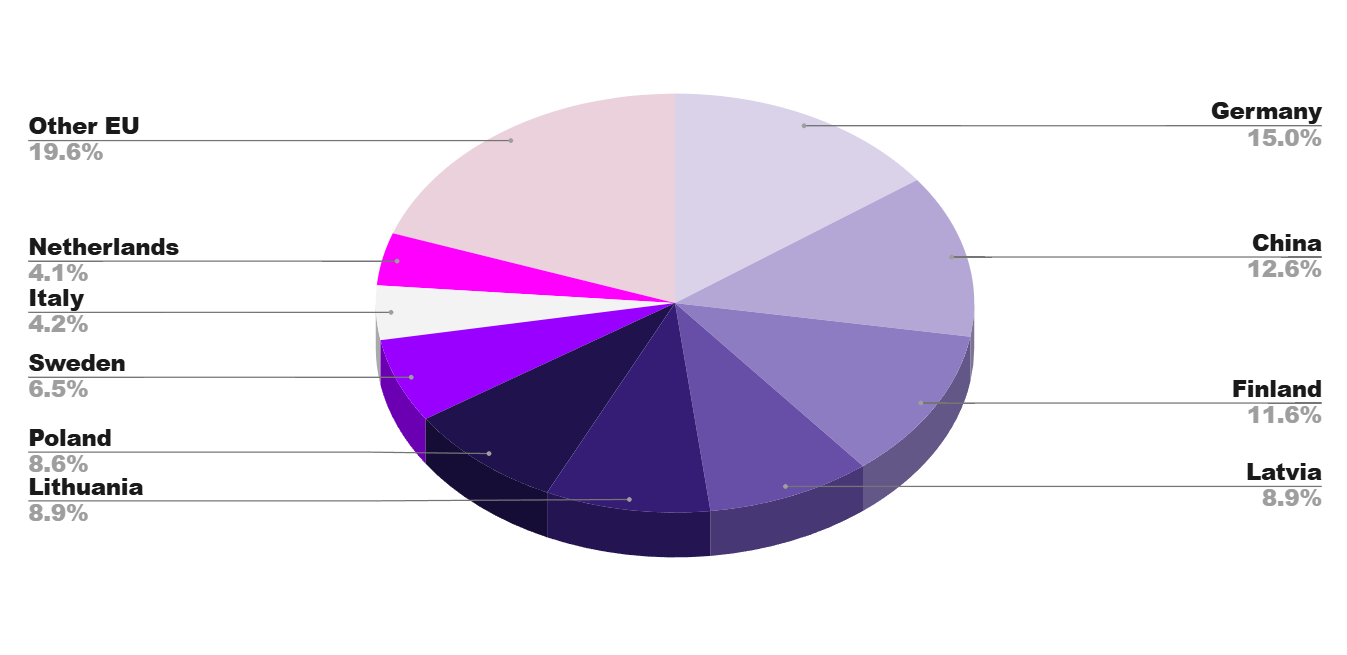
According to Estonia customs data, Germany, China, and Finland are its main importers, while its top products, which reflect its industrial and tech-driven economic structure, include cars, electrical equipment, and mineral fuels.