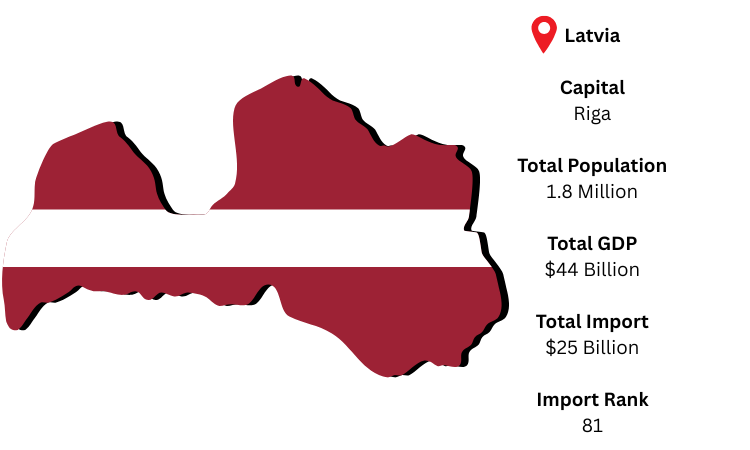
Trade between the EU and Eastern Europe is facilitated by Latvia, a Baltic country in Northern Europe. For its industries and customers, imports are essential, particularly for food, machinery, and energy. The capital and primary center of commerce is Riga. As per Latvia import data, with a population of over 1.8 million and a GDP of almost USD 44 billion, Latvia is expected to import approximately USD 25 billion in 2024, underscoring its open economy and reliance on trade.
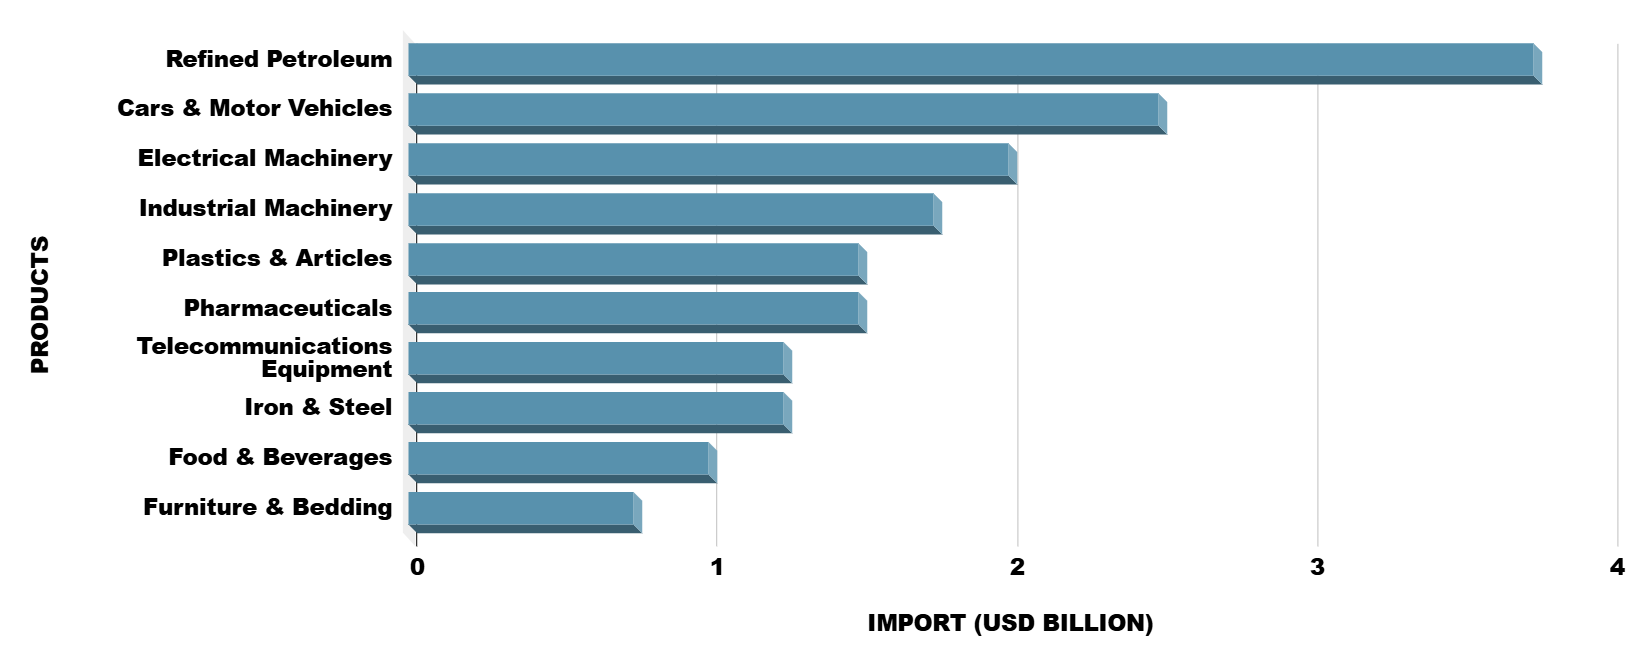
According to Latvia customs data, Latvia is heavily dependent on sophisticated machinery and refined petroleum, as seen by its top imports. Meeting domestic demand also heavily relies on consumer items like automobiles.