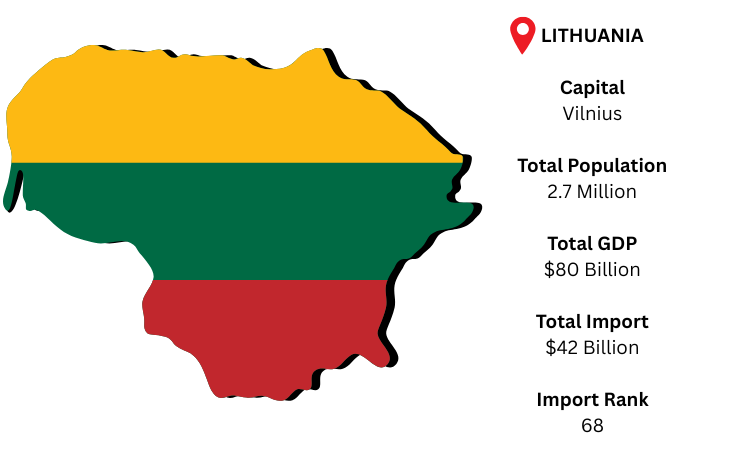
The largest Baltic nation, Lithuania, acts as a vital commercial bridge connecting Eastern and Northern Europe. To sustain its industrial and service sectors, its open economy is largely dependent on imports of consumer goods, machinery, and energy. The capital and the hub of the nation's economy and logistics is Vilnius. As per Lithuania import data, with a population of over 2.7 million and a GDP of almost USD 80 billion, Lithuania is expected to import approximately USD 42 billion in 2024, demonstrating its crucial position in regional and EU supply chains.
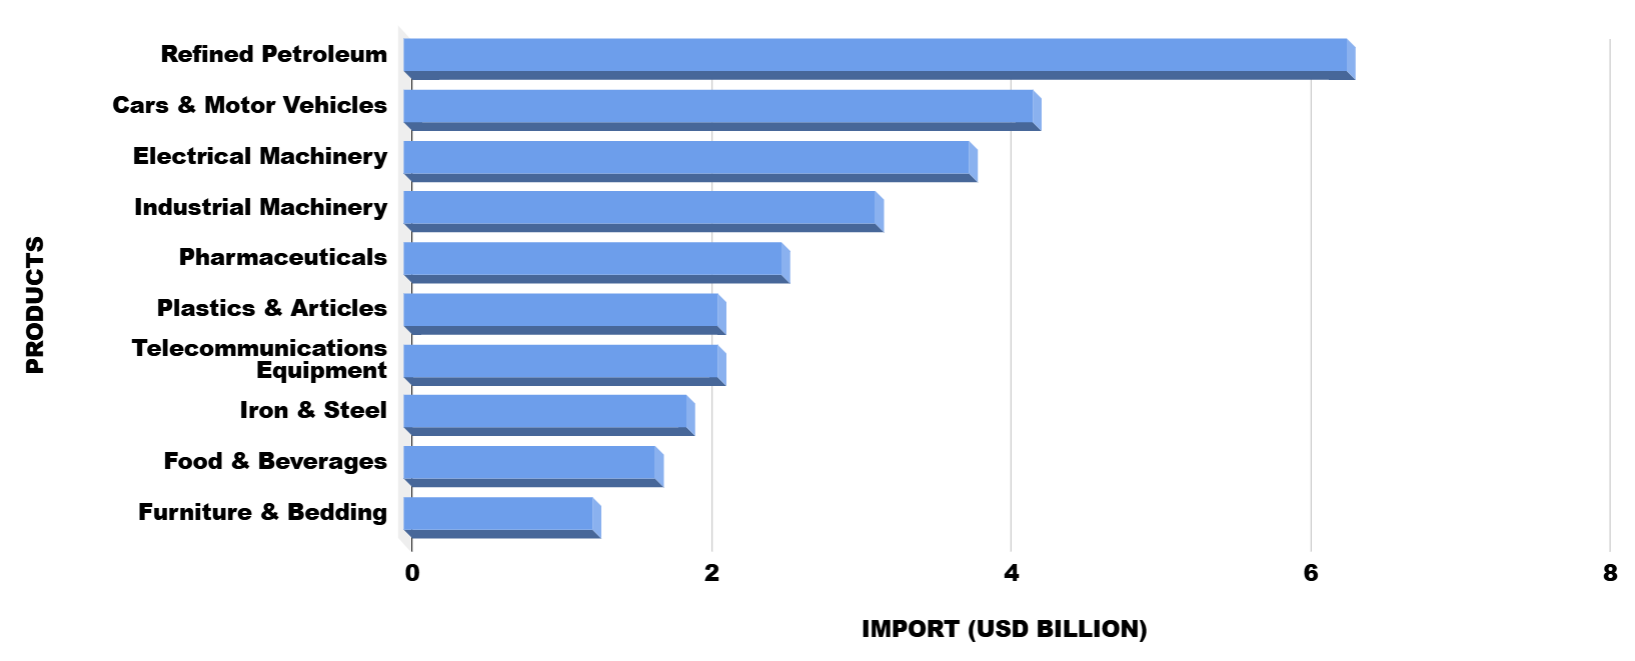
As per Lithuania customs data, Lithuania's import structure emphasizes how its industrial foundation and consumer market are powered by modern automobiles, machinery, and refined petroleum. Local demand is additionally supported by food and pharmaceutical products.