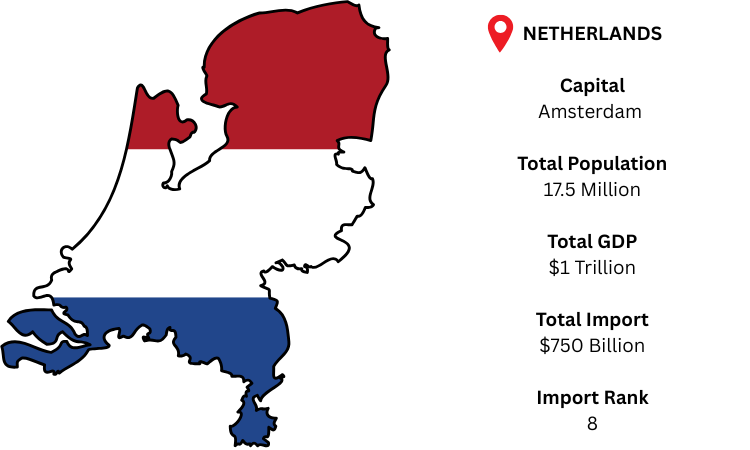
The Port of Rotterdam and Schiphol Airport make the Netherlands, which is well situated in Western Europe, one of the busiest trading gateways in the world. The nation is a significant center for food, equipment, chemicals, and energy. Rotterdam is the principal port for continental commerce, while Amsterdam is the capital. As per Netherlands import data, with a population of over 17.5 million and a GDP of nearly USD 1.0 trillion, the Netherlands is expected to import USD 750 billion, underscoring its significant position as a logistics and re-export hub in Europe.
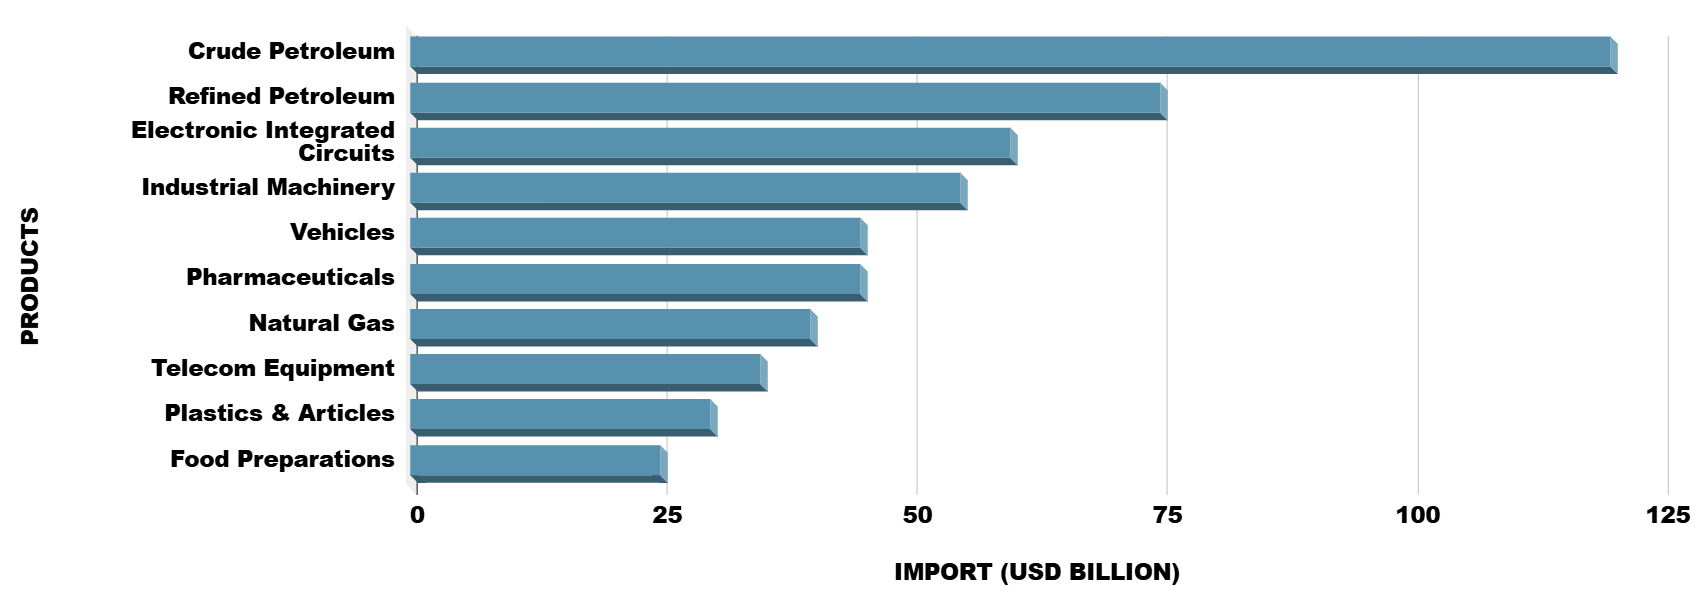
As per Netherlands customs data, while integrated circuits, equipment, and chemicals demonstrate their significance in Europe's modern manufacturing and re-export supply chains, crude and refined petroleum account for the majority of Dutch imports.