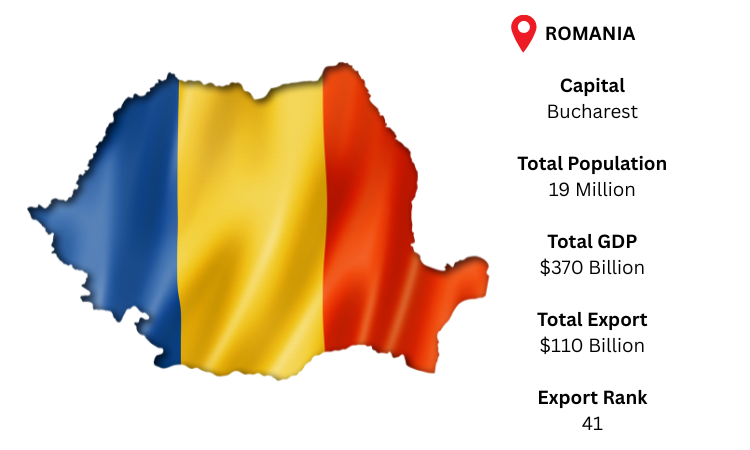
Romania Export Data

Romania Export Data

As per Romania export data, the country’s exports valued USD 71 billion in 2020. The total exports of the country increased by 9% year on year in August 2021.

As per Romania export trade data the value of merchandise exports from Romania totalled $ 71 billion in 2020. Overall commodity exports from Romania declined by 8.08% compared to 2019. According to Romania export custom data merchandise exports reduced by $ 6.25 billion the value of merchandise exports from Romania amounted to $77 billion in 2019.

As per Romania export statistics data shows Romania was 40th exporter country in the world during 2020. Based on Romania export trade statistics data show top exports for ‘Electronics’. While the top exporting partner is ‘Germany’, as per Romania export data of 2020.

Why Choose Our Romania Export Data

Our Romania shipment data is useful to every business type; start-ups to big corporates and every industry –Logistics and Market Researchers. Here is a short view about our Export data of Romania:

Data Available Till date

100% Coverage Trade Activity

Monthly Update Time

Sea, Air & Road Shipments Covered

100% Data Authenticity

Data Available on 2, 4, 6 & 8 digit Level HS Code

Historical Data Available Since 2010

Discover High Growth

Discover High Volume

Romania Export Custom Statistics Data Shows Top 10 Importing Products In 2020 – Analysis By Chapter

  • 18.5% for Chapter 85 - Electrical machinery and equipment and parts thereof; sound recorders and reproducers, television image and sound recorders and reproducers, and parts and accessories of such articles value of 13.1 billion US$
  • 17.1% for Chapter 87 - Vehicles other than railway or tramway rolling stock, and parts and accessories thereof value of 12.1 billion US$
  • 11.4% for Chapter 84 - Nuclear reactors, boilers, machinery and mechanical appliances; parts thereof value of 8.13 billion US$
  • 3.66% for Chapter 90 - Optical, photographic, cinematographic, measuring, checking, precision, medical or surgical instruments and apparatus; parts and accessories thereof value of 2.6 billion US$
  • 3.59% for Chapter 94 - Furniture; bedding, mattresses, mattress supports, cushions and similar stuffed furnishings; lamps and lighting fittings, not elsewhere specified or included; illuminated sign illuminated nameplates and the like; prefabricated build
  • 3.44% for Chapter 10 – Cereals value of 2.44 billion US$
  • 3.28% for Chapter 40 - Rubber and articles thereof value of 2.33 billion US$
  • 2.8% for Chapter 73 - Articles of iron or steel value of 1.99 billion US$
  • 2.73% for Chapter 72 - Iron and steel value of 1.94 billion US$
  • 2.59% for Chapter 44 - Wood and articles of wood; wood charcoal value of 1.84 billion US$

Romania Export Custom Trade Data Shows Top 10
Trading Partners
of Romania

  • Germany with a share of 22% (16.1 billion US$)
  • Italy with a share of 10.7% (7.62 billion US$)
  • France with a share of 6.73% (4.78 billion US$)
  • Hungary with a share of 4.99% (3.54 billion US$)
  • Poland with a share of 3.73% (2.65 billion US$)
  • Bulgaria with a share of 3.64% (2.58 billion US$)
  • Netherlands with a share of 3.55% (2.52 billion US$)
  • Turkey with a share of 3.36% (2.39 billion US$)
  • United Kingdom with a share of 3.34% (2.37 billion US$)
  • Czech Republic with a share of 3.09% (2.2 billion US$)

What our Romania Export Data contains

Romania export statistics data is a kind of Statistical data used for primary research of the market.  Romania export trade statistics data is calculated on shipping bills, export bills, invoices, and other export documents. It contains Year, Month, HS Code, Product Description, Quantity, Destination Country & Values Information. It gives a bird’s eye view of the country’s export business.

Export

Ask for Romania Export Sample Data and Demo

TOP