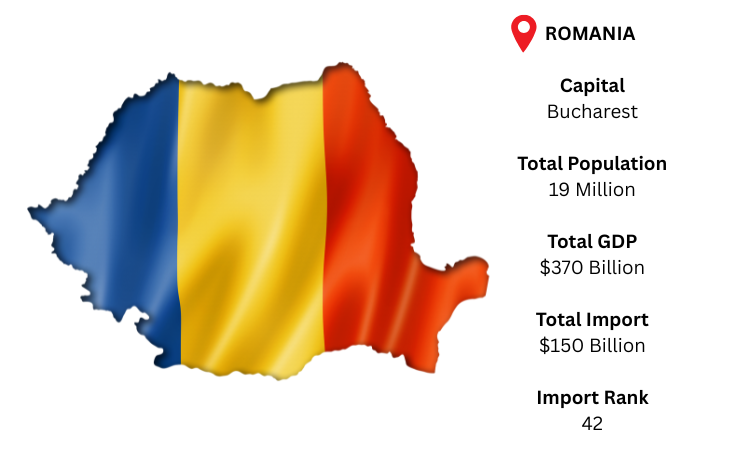
With a thriving industrial sector that imports electronics, automobiles, energy items, and machinery to support its manufacturing and consumer markets, Romania is a developing trading hub in Eastern Europe. Romania's capital is Bucharest, and its access to international suppliers is greatly aided by Black Sea ports such as Constanța. As per Romania import data, Romania, which has a population of over 19 million and a GDP of approximately USD 370 billion, is expected to import roughly USD 150 billion in total, indicating a growing need for intermediate and completed products.
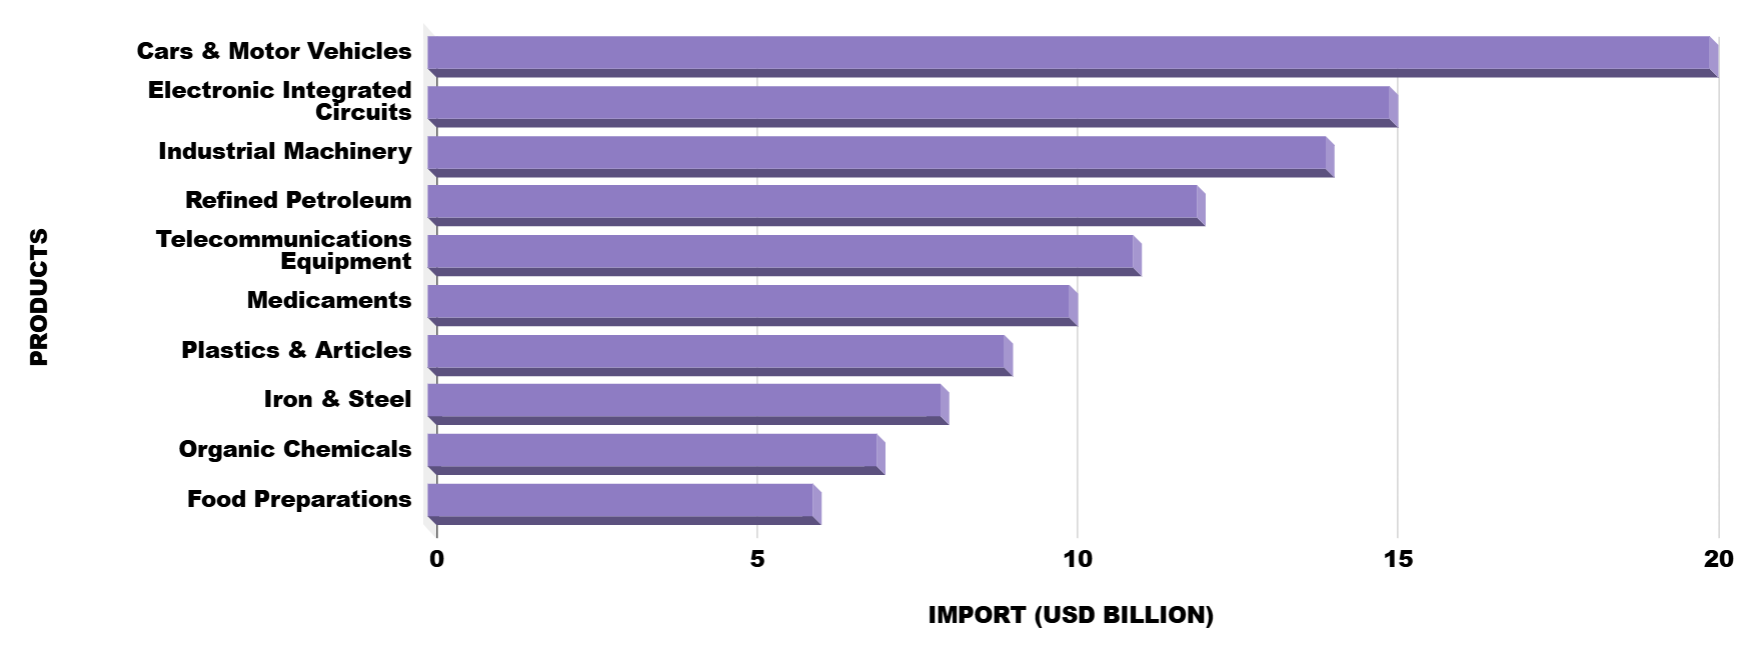
As per Romania customs data, strong demand for automobiles, electronics, gasoline, and industrial inputs is evident in Romania's import structure, which supports the country's expanding consumer and production sectors.