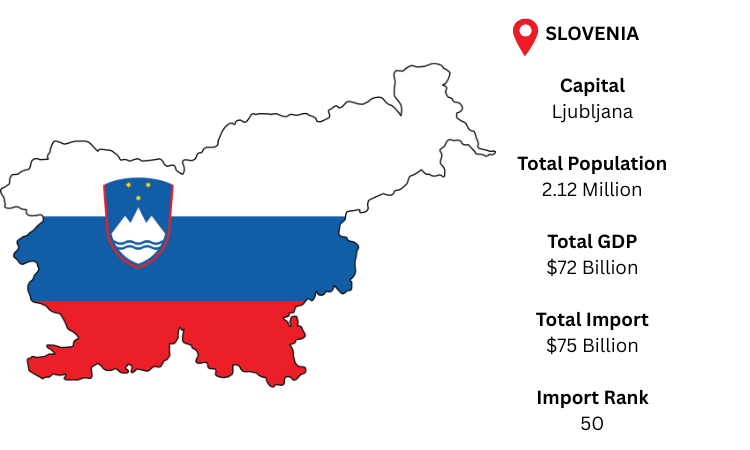
The advanced industrial, pharmaceutical, and automotive industries of Slovenia, a wealthy Central European nation, are mostly dependent on imports. Ljubljana's capital is mainly connected to international markets by road and rail through EU corridors. As per Slovenia import data, with a population of over 2.12 million and a GDP of about USD 72 billion, Slovenia is expected to import roughly USD 75 billion in total, showing a stable demand for electronics, cars, and chemicals.
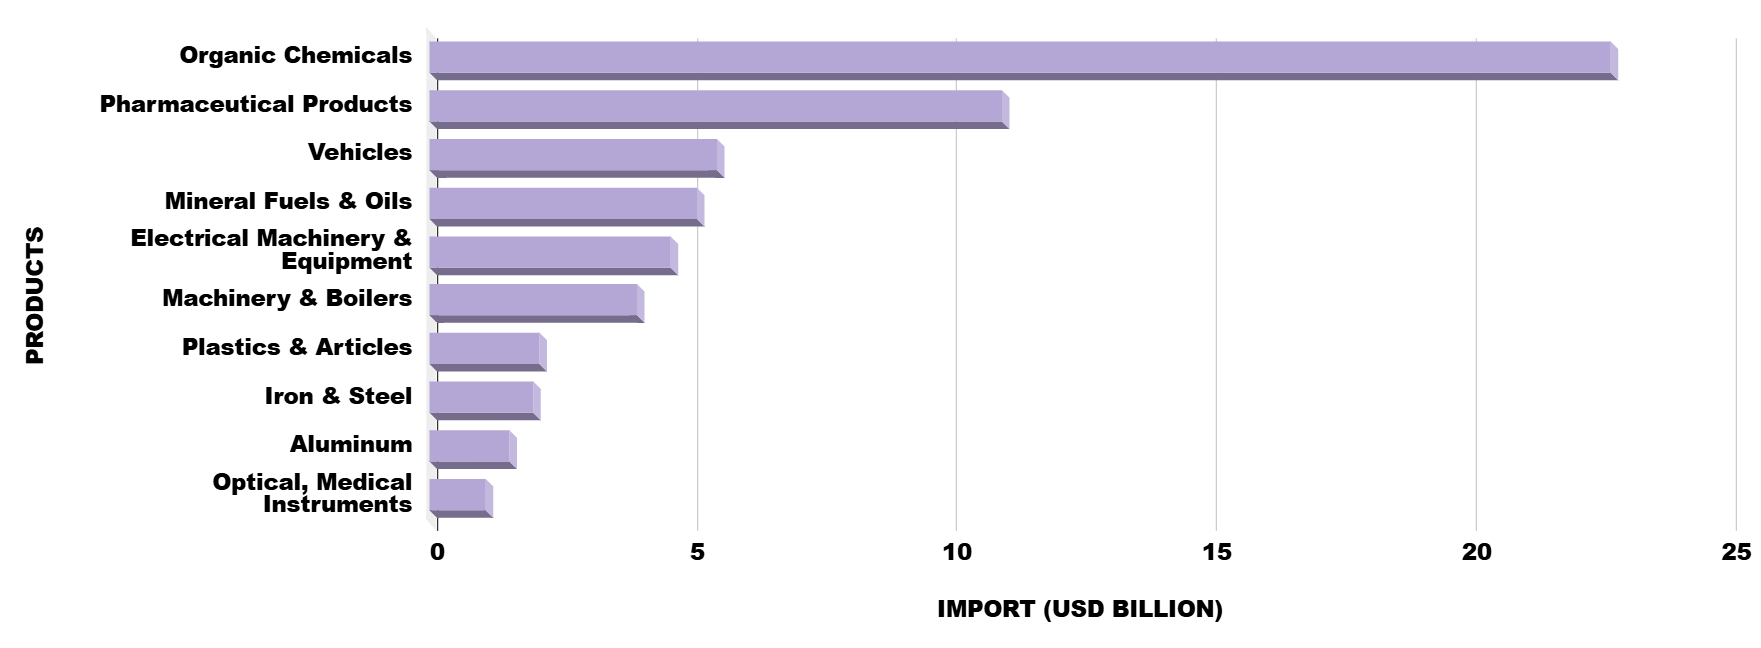
As per Slovenia customs data, Slovenia's industrial reliance on expensive chemicals, medicines, automobiles, and sophisticated machinery, essential inputs for its local production, is evident from the import data.