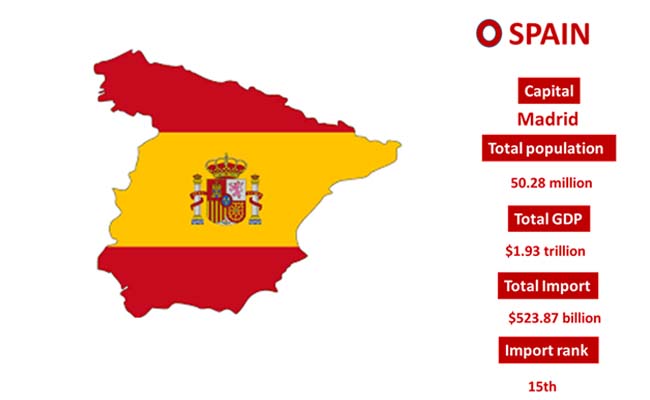
Spain Import Data

Spain Import Data

As per Spain import data, the country imported goods worth USD 325 billion in 2020 as compared to USD 375 billion in 2019. Imports of the country recorded to USD 34.8 billion in August 2021.             

The Spain import trade data shows that country ranks 15th in the world during 2020. As per Spain import custom data the value of merchandise imports to Spain totalled $ 329 billion in 2020. Overall commodity imports to Spain declined by 12.1% compared to 2019. Merchandise imports reduced by $ 45 billion the value of merchandise imports to Spain was equal to $ 375 billion in 2019.

As per the Spain import statistics data, the major imports were vehicles in 2020. The highest importing partner was Germany.

Why Choose Our Spain Import Data

Our Spain shipment data is useful to every business type; start-ups to big corporates and every industry –Logistics and Market Researchers. Here is a short view about our Import data of Spain:

Data Available Till date

100% Coverage Trade Activity

Monthly Update Time

Sea, Air & Road Shipments Covered

100% Data Authenticity

Data Available on 2, 4, 6 & 8 digit Level HS Code

Historical Data Available Since 2010

Discover High Growth

Discover High Volume

Spain Import Custom Statistics Data Shows Top 10 Importing Products In 2020 – Analysis By Chapter

  • 10.4% for Chapter 87 - Vehicles other than railway or tramway rolling stock, and parts and accessories thereof value of 34 billion US$
  • 9.63% for Chapter 84 - Nuclear reactors, boilers, machinery and mechanical appliances; parts thereof value of 31 billion US$
  • 9.36% for Chapter 27 - Mineral fuels, mineral oils and products of their distillation; bituminous substances; mineral waxes value of 30 billion US$
  • 8.65% for Chapter 85 - Electrical machinery and equipment and parts thereof; sound recorders and reproducers, television image and sound recorders and reproducers, and parts and accessories of such articles value of 28 billion US$
  • 5.11% for Chapter 30 - Pharmaceutical products 16.8 billion US$
  • 5% for Chapter 99 - Commodities not specified according to kind value of 16.5 billion US$
  • 3.61% for Chapter 39 - Plastics and articles thereof value of 11.9 billion US$
  • 3.44% for Chapter 29 - Organic chemicals value of 11.3 billion US$
  • 2.64% for Chapter 90 - Optical, photographic, cinematographic, measuring, checking, precision, medical or surgical instruments and apparatus; parts and accessories thereof value of 8.71 billion US$
  • 2.63% for Chapter 62 - Articles of apparel and clothing accessories, not knitted or crocheted value of 8.67 billion US$

Spain Import Custom Trade Data Shows Top 10
Trading Partners
of Spain

  • Germany with a share of 11.8% (39 billion US$)
  • China with a share of 10.1% (33 billion US$)
  • France with a share of 9.88% (32 billion US$)
  • Italy with a share of 6.16% (20 billion US$)
  • Other Europe, nes with a share of 5.92% (19.5 billion US$)
  • USA with a share of 4.86% (16 billion US$)
  • Netherlands with a share of 4.37% (14.4 billion US$)
  • Portugal with a share of 3.72% (12.2 billion US$)
  • United Kingdom with a share of 3.24% (10.6 billion US$)
  • Belgium with a share of 2.39% (7.9 billion US$)

Spain Import Data Sample

What our Spain Import Data contains

It is a kind of statistical data, which is useful for primary research on the import activities of the country. The Spain import trade statistics data is based on Shipping bills, import bills, invoices and other import-export documents. It contains Year, Month, HS Code, Product Description, Quantity, Exporting Country & Values Information. It gives a bird’s eye view of the country’s import business.

Import

Ask for Spain Import Sample Data and Demo

TOP