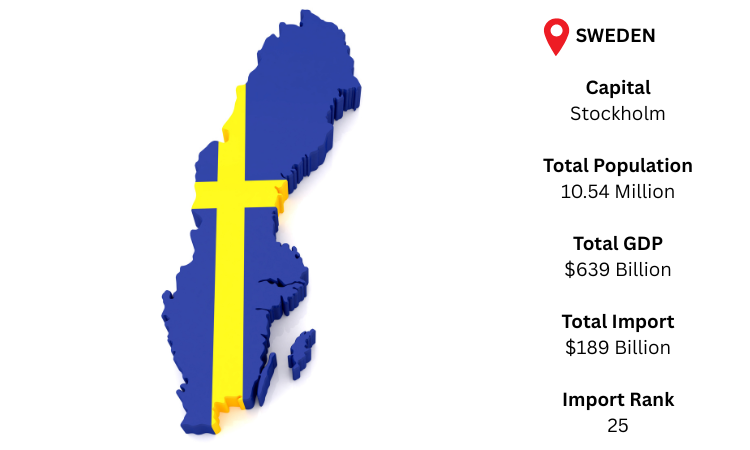
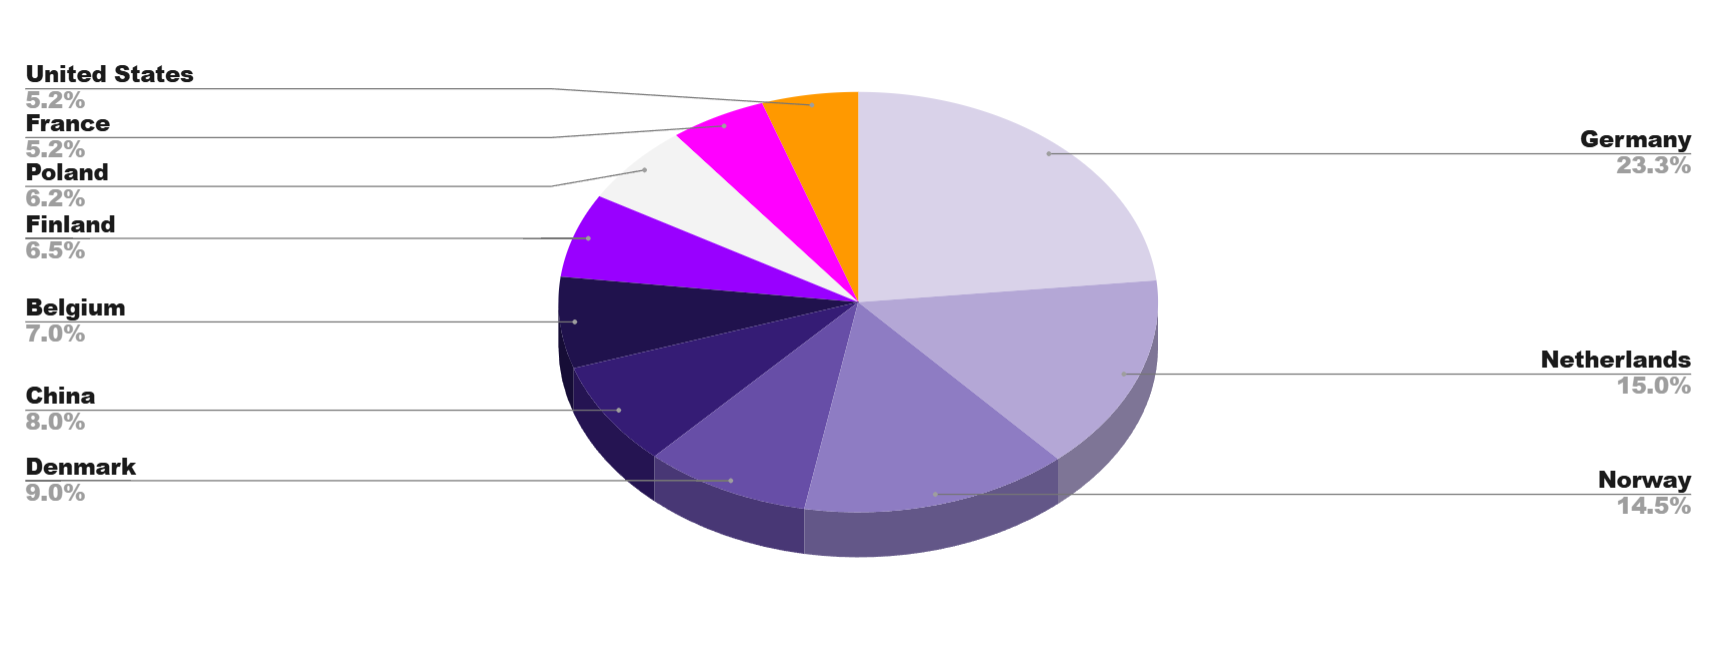
Sweden, a wealthy Nordic nation, depends on imports to sustain its energy, automotive, and sophisticated industrial sectors. The capital is Stockholm. Sweden retains a strong trading position with a population of around 10.54 million and a GDP of USD 639 billion. As per Sweden import data, a tiny trade surplus of USD 6.8 billion is produced when total imports reached USD 189.0 billion, slightly less than total exports of USD 195.8 billion.
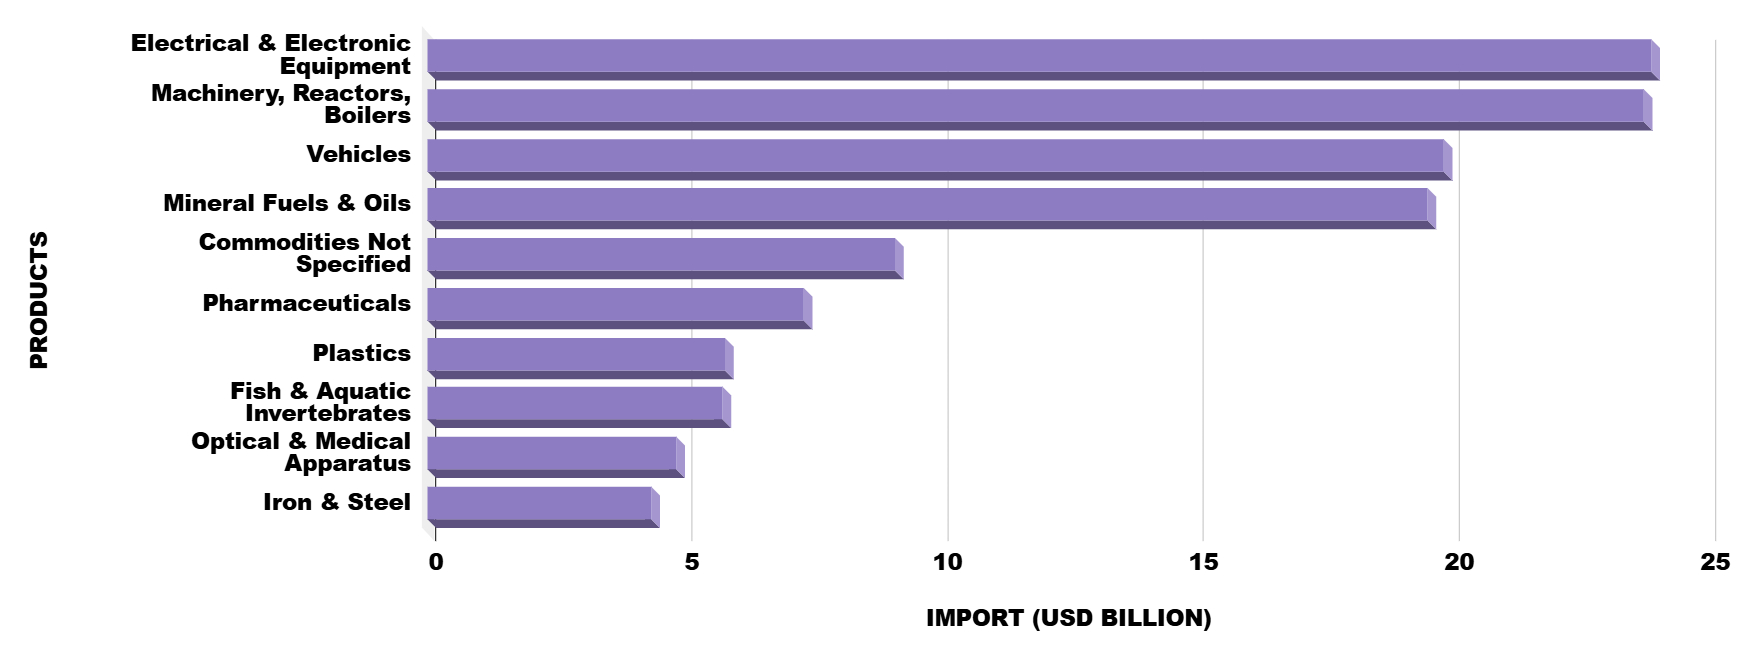
As per Sweden customs data, with the help of vital energy and car imports, Sweden's import basket is dominated by electronics and machinery, highlighting its place in the Nordic and European industrial value chains.