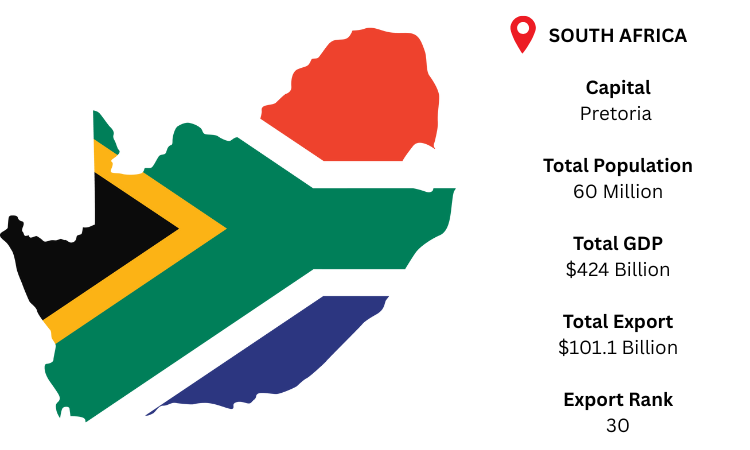
South Africa Export Data

South Africa Export Data

As per South Africa export data, the country’s exports valued USD 86 billion in 2020 and USD 90 billion on 2019. The total exports of the country increased 15.8% year on year in September 2021.

As per South Africa export trade data the value of merchandise exports from South Africa totalled $ 85 billion in 2020. Overall commodity exports from South Africa declined by 4.66% compared to 2019. Merchandise exports reduced by $ 4.16 billion the value of merchandise exports from South Africa amounted to $ 89 billion in 2019.

As per South Africa export custom data shows South Africa was 7th exporter country in the world during 2020. According to South Africa export statistics data 2020, the majority exports pearls, stones and metals. The major exporting partner in 2020 was China.

Why Choose Our South Africa Export Data

Our South Africa shipment data is useful to every business type; start-ups to big corporates and every industry –Logistics and Market Researchers. Here is a short view about our Export data of South Africa:

Data Available Till date

100% Coverage Trade Activity

Monthly Update Time

Sea, Air & Road Shipments Covered

100% Data Authenticity

Data Available on 2, 4, 6 & 8 digit Level HS Code

Historical Data Available Since 2010

Discover High Growth

Discover High Volume

South Africa Export Custom Statistics Data Shows Top 10 Importing Products In 2020 – Analysis By Chapter

  • 22% for Chapter 71 - Natural or cultured pearls, precious or semi-precious stones, precious metals, metals clad with precious metal and articles thereof; imitation jewellery; coin value of 19.2 billion US$
  • 14.9% for Chapter 26 - Ores, slag and ash value of 12.7 billion US$
  • 9.83% for Chapter 87 - Vehicles other than railway or tramway rolling stock, and parts and accessories thereof value of 8.37 billion US$
  • 8.09% for Chapter 27 - Mineral fuels, mineral oils and products of their distillation; bituminous substances; mineral waxes value of 6.9 billion US$
  • 5.79% for Chapter 84 - Nuclear reactors, boilers, machinery and mechanical appliances; parts thereof value of 4.93 billion US$
  • 4.67% for Chapter 72 - Iron and steel value of 3.98 billion US$
  • 4.49% for Chapter 08 - Edible fruit and nuts; peel of citrus fruit or melons value of 3.83 billion US$
  • 1.89% for Chapter 76 - Aluminium and articles thereof value of 1.61 billion US$
  • 1.76% for Chapter 85 - Electrical machinery and equipment and parts thereof; sound recorders and reproducers, television image and sound recorders and reproducers, and parts and accessories of such articles value of 1.5 billion US$
  • 1.76% for Chapter 38 - Miscellaneous chemical products value of 1.5 billion US$

South Africa Export Custom Trade Data Shows Top 10
Trading Partners
of South Africa

  • China with a share of 11.4% (9.79 billion US$)
  • USA with a share of 8.36% (7.13 billion US$)
  • Areas, nes with a share of 8.08% (6.89 billion US$)
  • Germany with a share of 7.5% (6.39 billion US$)
  • United Kingdom with a share of 4.97% (4.24 billion US$)
  • Japan with a share of 4.45% (3.79 billion US$)
  • Netherlands with a share of 3.88% (3.3 billion US$)
  • Botswana with a share of 3.84% (3.27 billion US$)
  • India with a share of 3.78% (3.22 billion US$)
  • Mozambique with a share of 3.62% (3.08 billion US$)

What our South Africa Export Data contains

South Africa export statistics data is a kind of Statistical data used for primary research of the market. South Africa export trade statistics data is calculated on shipping bills, export bills, invoices, and other export documents. It contains Year, Month, HS Code, Product Description, Quantity, Destination Country & Values Information. It gives a bird’s eye view of the country’s export business.

Export

Ask for South Africa Export Sample Data and Demo

TOP