South Africa Import Data

South Africa Import Data

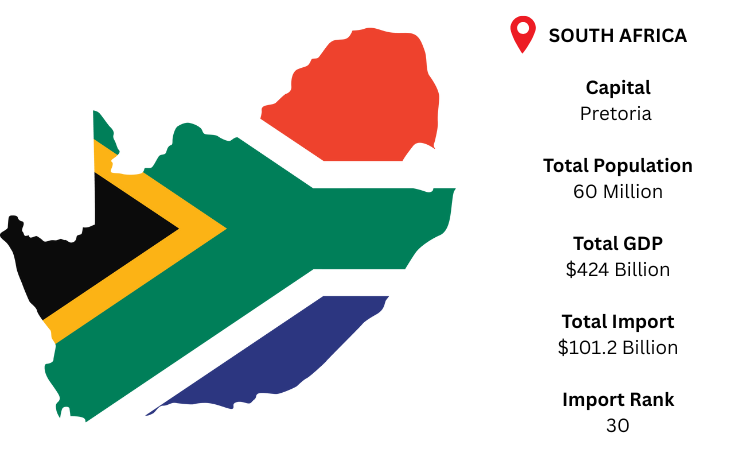
South Africa is the continent’s most industrialized economy, importing key resources to support its energy, manufacturing, and consumer sectors. Pretoria is the administrative capital (with Johannesburg as the economic hub). As per South Africa import data, with a population of about 60 million and a GDP of around USD 424 billion, total imports reached approximately USD 101.2 billion, reflecting steady industrial and consumer demand.

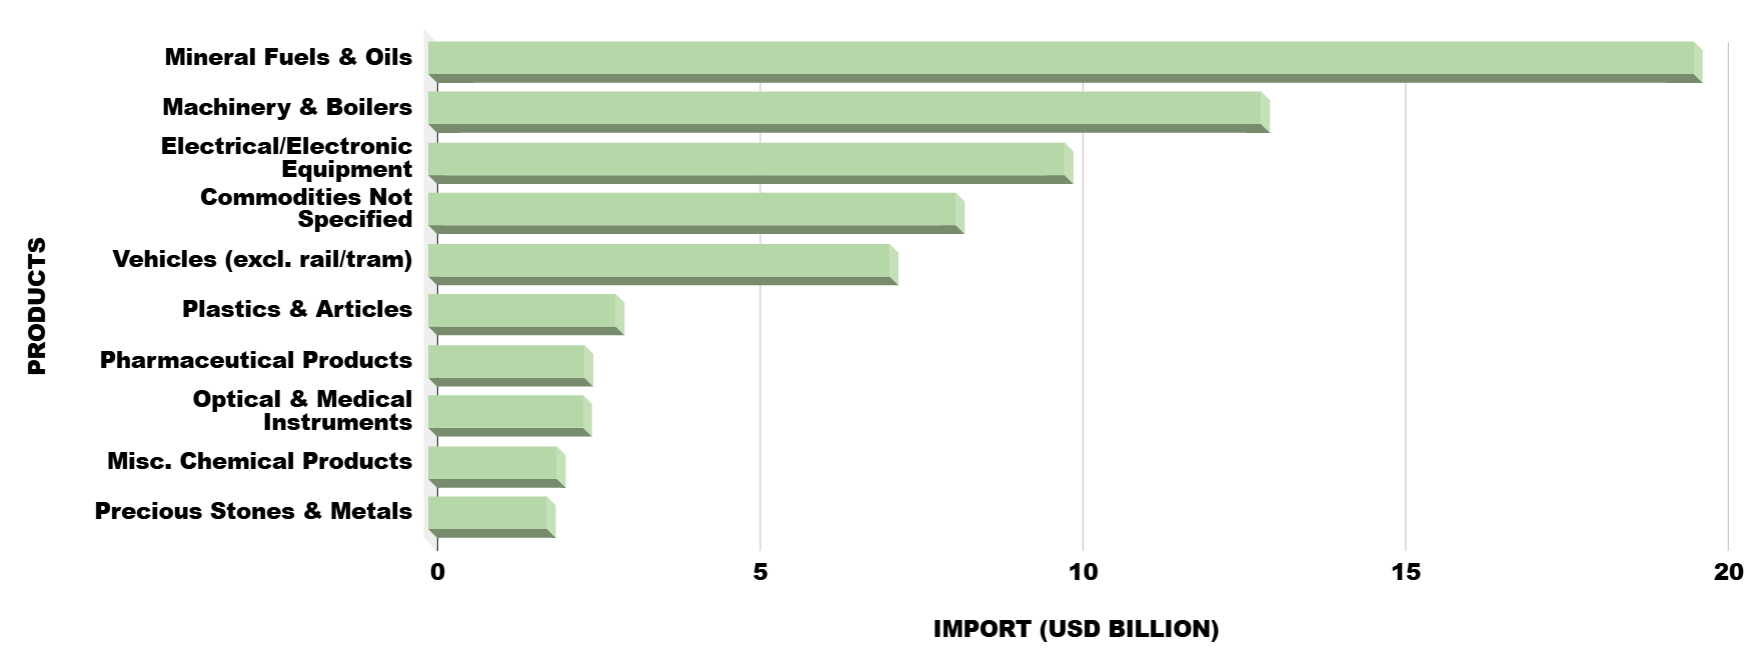
As per South Africa customs data, South Africa's manufacturing base is reflected in the significant amounts of automobiles, plastics, and medical-industrial goods it imports, which are mostly energy (fuels), machinery, and electronics.

30

Among the top 30 global importers.

0.6%

South Africa accounts for around 0.6% of total world imports.

China

With USD 21.8 billion in exports, about 21.5% of total imports.

Mineral fuels & oils

Valued at USD 19.6 billion (19.4% of imports).


Top 10 Import Products of South Africa

As per South Africa customs import data, automobiles, equipment, electronics, energy, and industrial and medical products make up the majority of South Africa's import basket.

  • Mineral Fuels & Oils (HS 27): USD 19.6 B — 19.4%
  • Machinery & Boilers (HS 84): USD 12.9 B — 12.8%
  • Electrical/Electronic Equipment (HS 85): USD 9.86 B — 9.7%
  • Unspecified Commodities: USD 8.17 B — 8.1%
  • Vehicles (HS 87): USD 7.14 B — 7.1%
  • Plastics & Articles (HS 39): USD 2.90 B — 2.9%
  • Pharmaceutical Products (HS 30): USD 2.42 B — 2.4%
  • Optical & Medical Instruments (HS 90): USD 2.40 B — 2.4%
  • Chemical Products (HS 38): USD 1.99 B — 2.0%
  • Precious Stones & Metals (HS 71): USD 1.84 B — 1.8%
Product Image
Product Image

Top 10 Import Trading Partners of South Africa

As per South Africa shipments data, China, the United States, and Germany are the top importers into South Africa from Asia and Europe.

  • China: 21.5% — USD 21.8 B
  • United States: 8.6% — USD 9.2 B
  • Germany: 8.1% — USD 8.7 B
  • India: 7.0% — USD 7.5 B
  • UAE: 3.7% — USD 4.0 B
  • Thailand: 3.3% — USD 3.5 B
  • Saudi Arabia: 2.9% — USD 3.1 B
  • Japan: 2.5% — USD 2.7 B
  • Oman: 2.4% — USD 2.6 B
  • Italy: 2.2% — USD 2.4 B

What Details Contain In South Africa Import Data?

Every shipment arriving by land, air, or sea is included in South Africa’s statistical import data. Businesses and analysts may use a comprehensive statistical dataset that includes essential trade statistics to gain a thorough understanding of the Italian import sector. The information helps customers assess trade flows, identify new possibilities, and follow supplier trends by recording each shipment's route, product categorization, stated values, and more. An essential resource for making well-informed decisions, whether assessing competition or broadening market reach, is the South African import statistics. Usually, the statistical dataset consists of:

  • Date 
  • HS Code
  • HS Code Description
  • Total Value in USD
  • FOB Value
  • Quantity
  • Weight
  • Way of Transport
  • Destination Country
  • Import Country
  • Port of Loading
  • Port of Unloading

Benefits of South Africa Import data in your business

  • Gain a competitive edge by benchmarking competitors, finding new suppliers, and thoroughly understanding your industry using the South African import statistical data.
  • Investigate International Markets: Examine South Africa’s purchasing trends to identify potential import markets for your goods.
  • Data-Driven Decisions: Make defensible decisions supported by up-to-date, transparent shipping data.
  • Reduce Risks: Before signing contracts, review shipping history and look for any possible warning signs.
  • Reliable and Accurate: High accuracy is ensured by the data's sourcing from official customs records.
  • Competitor insights: Keep tabs on where and how rivals obtain their goods.

FIND OUT OTHER AFRICA COUNTRIES IMPORT EXPORT DATA

Ask for South Africa Import Sample Data and Demo

Whatsapp
TOP