
Kenya Tea Exports in 2026: Major Buyers, Export Trends and Global Market Opportunities

- Oct 31, 2026
- 69 Views
Kenya Tea Exports in 2026: Major Buyers, Export Trends and Global Market Opportunities
Kenyan tea exports are a vital part of the country’s economy, generating foreign exchange, supporting agricultural employment and building international trade relations. Kenyan tea is a major commodity in the world markets due to its quality, unique taste and constant supply in 2026 . Major producer and exporter of black tea to customers in Africa, Asia, Europe and the Middle East.
The existing production zones that sustain Kenya’s tea exports are Kericho, Nandi, Bomet and Nyeri. Kenyan suppliers sell to foreign buyers through auction markets and direct sales. Production is a mix of smallholder farmers and large tea estates. Kenya tea is marketed in major markets such as Pakistan, Egypt, UK, UAE and other regional markets.
Kenya Export Data helps companies to know the market trends, top export destinations, product demand, shipment trends and buyers. Kenya Import Data offers insights into the arriving goods and the context of sourcing relations. They use Kenya Trade Data to help firms analyze trade flows, assess market opportunities and track changes in global demand.
Businesses can also research shipment history, product categorization and trade patterns where the data is available and accessible from the Kenya Customs Data. The tea industry is a fertile ground for exporters, importers, distributors and market researchers who want to expand their footprint and can benefit immensely from reliable trade intelligence.
Import Globals offers useful information about trading for those who consider the Kenyan tea export industry in 2026. The exporters, importers, and distributors will be able to utilize the benefits of import-export information, shipment data, and market research across the globe to find out new customers, understand the actions of the competitors, and reveal new markets.
Kenya’s Tea Export Value and Trade Growth Trends
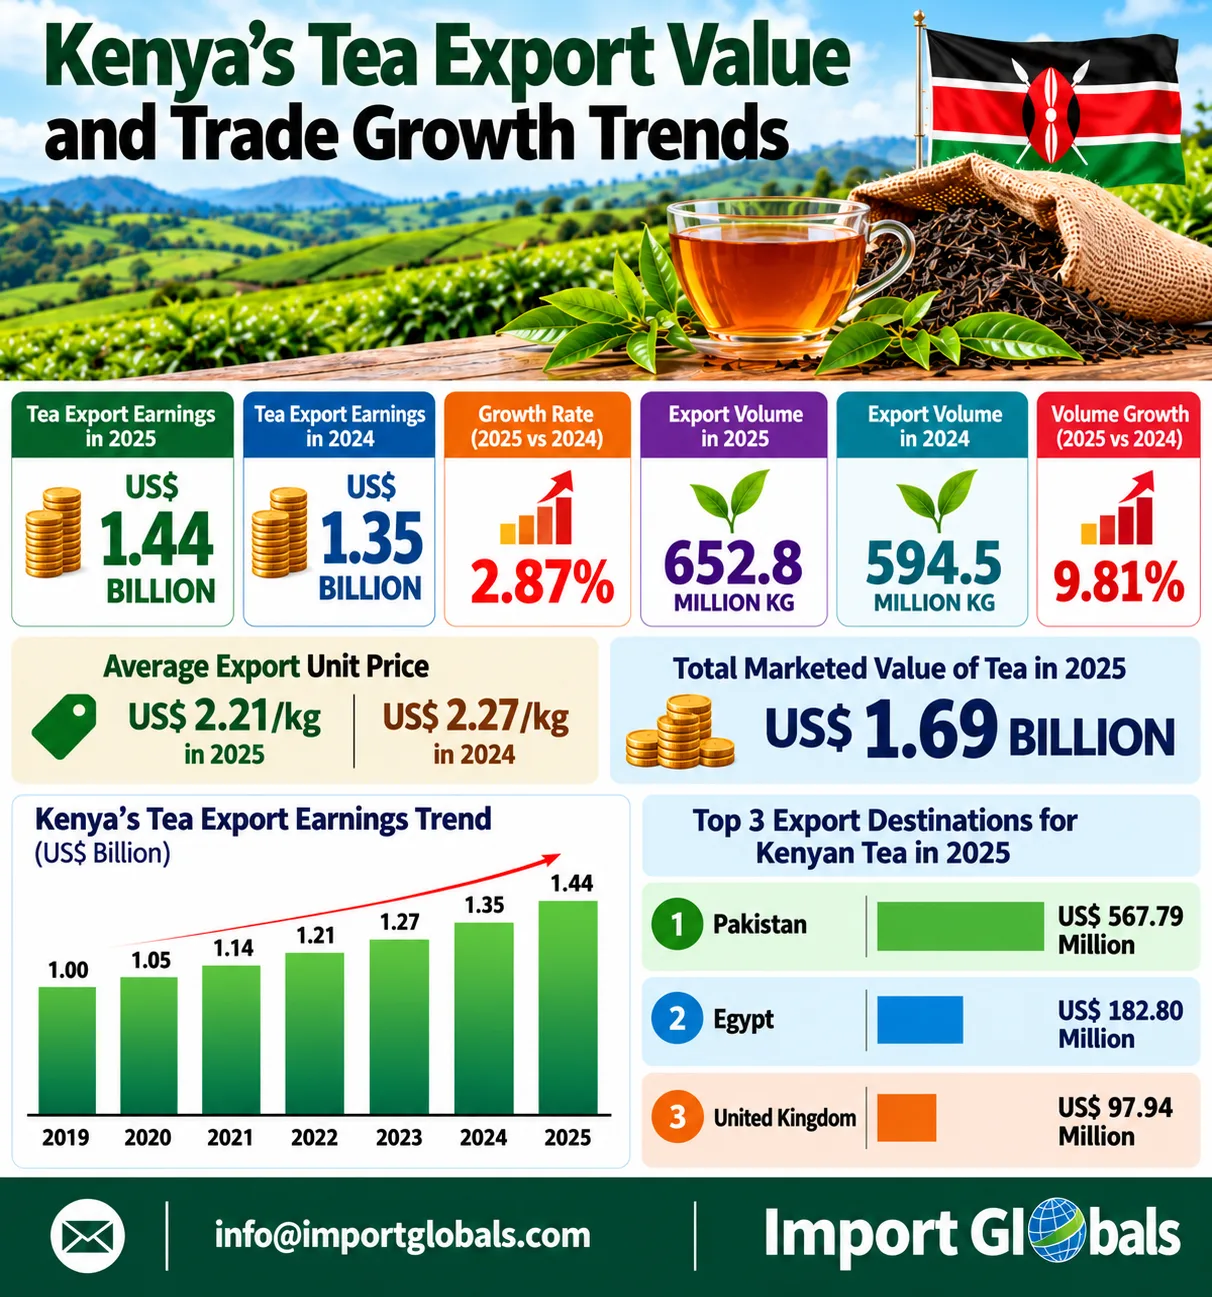
Kenya’s tea exports continue to be a vital pillar of the country’s agricultural economy and foreign exchange earnings. Tea export earnings were around $1.44 billion in 2025 against $1.35 billion in 2024, according to the Tea Board of Kenya’s 2025 industry performance report. In Kenyan shilling terms, export earnings increased 2.87 percent to KSh 186.91 billion.
Export volumes also increased sharply. In 2025, Kenya Tea Exports were around 652.8 million Kilograms, up by 9.81% from 594.5 million Kilograms in 2024. The unit price of exports was US$2.27 per kilogram in 2024 and decreased to US$2.21 in 2025. “That means more shipments, so more revenue, but less favorable pricing.”
Kenya’s biggest export market for tea was Pakistan. According to the World Bank’s WITS data sourced from UN Comtrade, Kenya exported black tea worth US$567.79 million to Pakistan in 2025. Egypt followed with US$182.80 million while exports to the United Kingdom stood at US$97.94 million. These are figures for HS 090240 black tea only, not for all tea products.
Future growth of Kenya’s tea trade will hinge on better processing, premium tea production, stable international demand and market diversification. Kenya Trade Data assist businesses in finding buyers, analyzing shipment trends and discovering new markets. Import Globals is a trade intelligence service provider that assists companies in exploring global trade patterns and identifying potential export opportunities in 2026.
Top 10 Countries Importing Tea from Kenya in 2026
Kenya is a leading global supplier of black tea to buyers in Asia, the Middle East, Europe and Africa. The country’s tea export performance in 2026 will continue to be impacted by international demand, auction prices and shipment volumes. But the full 2026 annual numbers are not yet available, so the latest full-year 2025 trade data provides a good baseline for spotting the top buyers.
Top Importing Countries and Trade Values
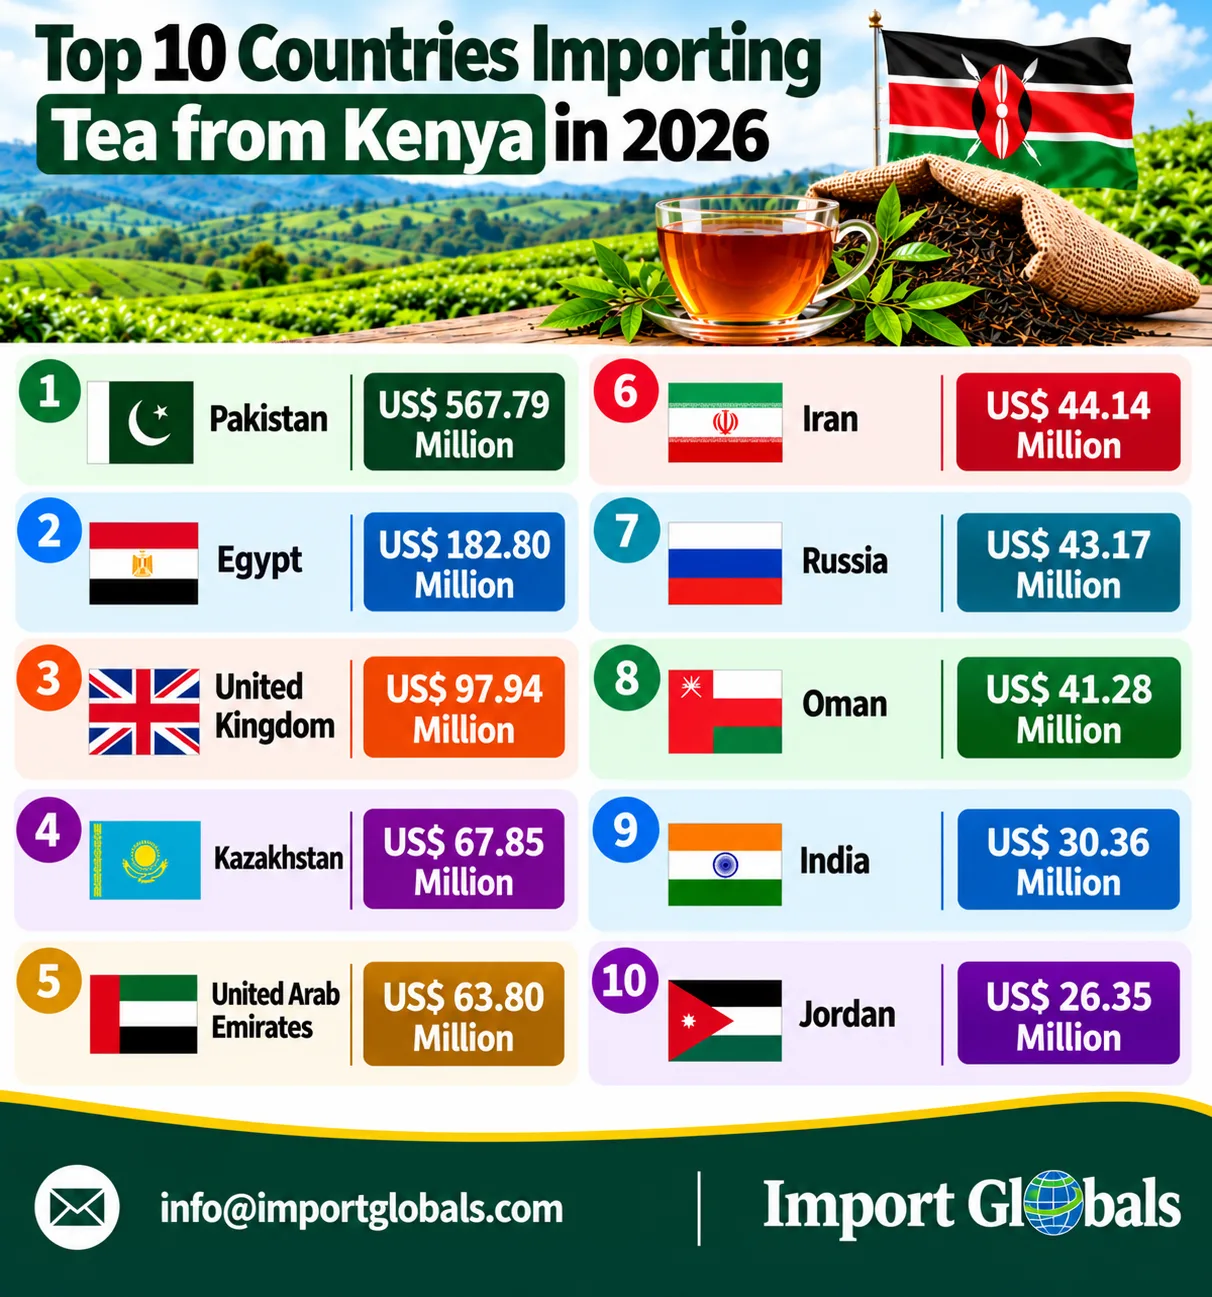
The rankings below are based on 2025 export values for Kenyan black tea—the latest full-year data available in the source cited.
1. Pakistan — US$567.79 Million: Kenya’s largest market for black tea exports is Pakistan. With Pakistan Import Data, businesses can examine Kenyan tea purchases, the volumes of shipments, and potential buyers.
2. Egypt — US$182.80 Million: Egypt is another important market for Kenyan black tea. Egypt Import Data is providing information about tea sourcing trends, import demand and supplier relations.
3. United Kingdom — US$97.94 Million: Kenyan tea is still a significant European market for the UK. UK Import Data helps exporters to research shipment trends, buyers and market opportunities.
4. Kazakhstan — US$67.85 Million: Kenya’s black tea is a key Central Asian purchase by Kazakhstan. Kazakhstan Import Data enables businesses to research import volumes, supplier networks and sourcing trends.
5. United Arab Emirates — US$63.80 Million: Tea is one of the UAE’s key products and markets. UAE Import Data helps to know the potential buyers, distribution channels and trends of tea shipment.
6. Iran — US$44.14 Million: Iran black tea is also being sent from Kenya. Traders can use Iran Import Data to study the import of tea, the behavior of suppliers, and the evolving market demand.
7. Russia — US$43.17 Million: Russia represents a notable market for Kenyan tea. Russia Import Data supports research into sourcing patterns, shipment activity, and potential distribution partners.
8. Oman — US$41.28 Million: Kenya Black Tea is a favorite place in Oman. Oman Import Data helps businesses in analyzing the demand of tea, region wise trade opportunities and importing companies.
9. India — US$30.36 Million: Despite having a big tea industry in the country, India imports Kenyan black tea. Patterns of trade show what demand there is for different sorts of tea and pricing and supply needs.
10. Jordan — US$26.35 Million: Jordan also receives shipments of Kenyan tea. Jordan Import Data helps traders to track sourcing trends, identify importers and find business opportunities.
Major Tea Varieties Exported by Kenya and Their HS Codes
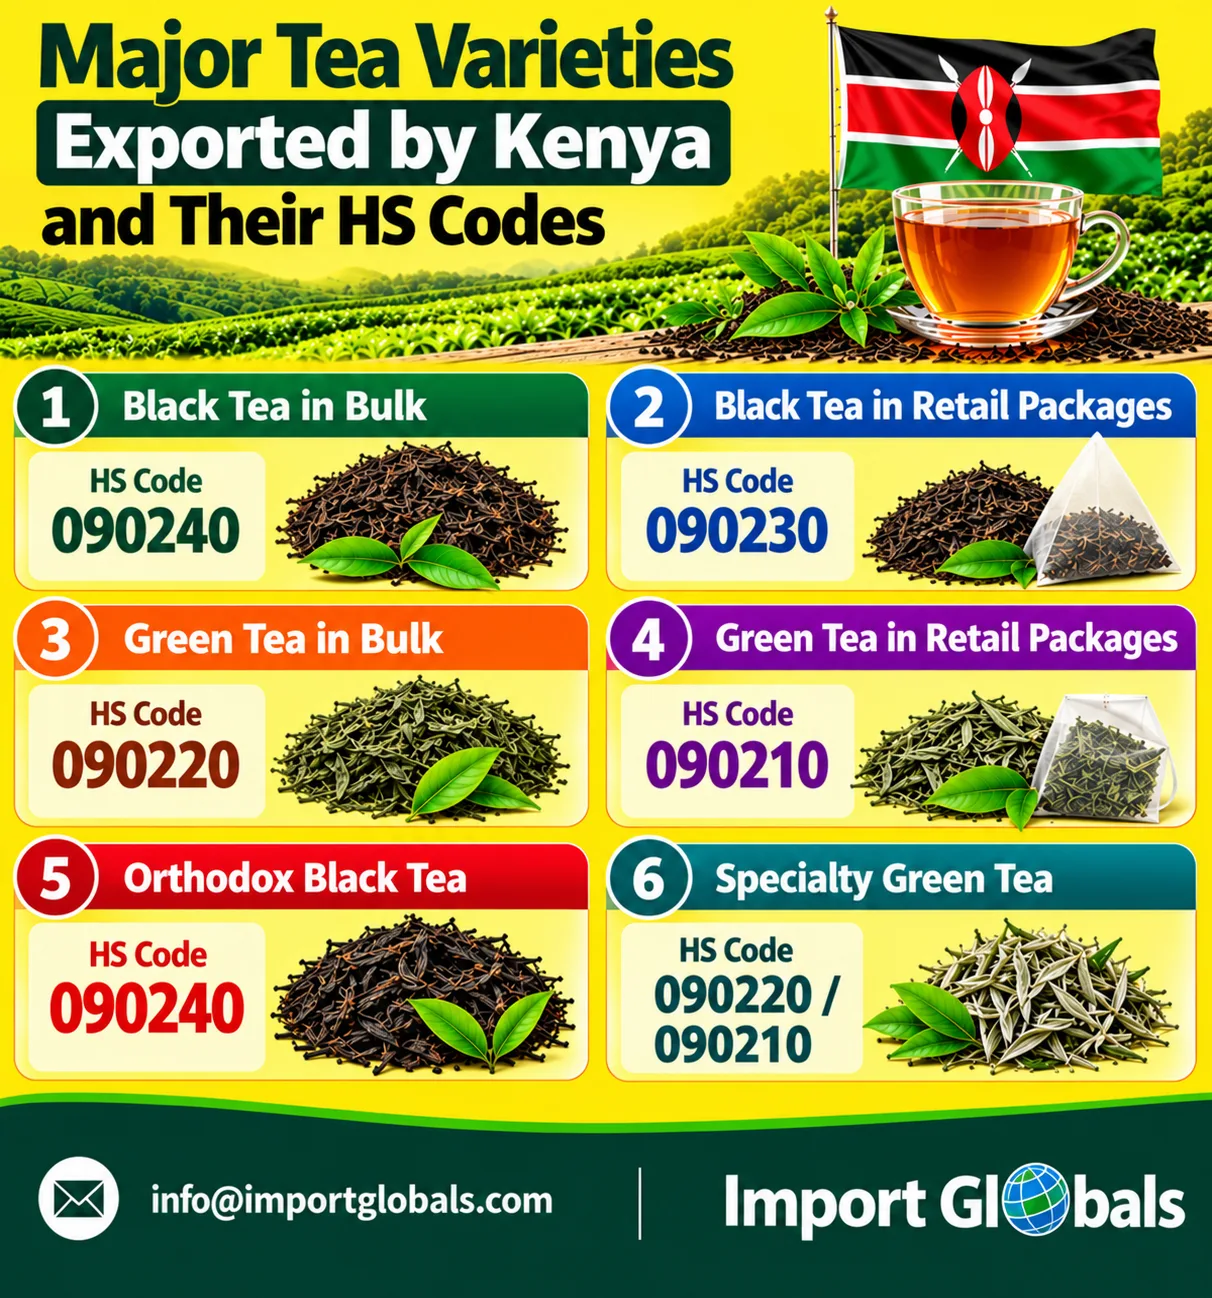
Kenya sells a wide range of teas to global markets. Black tea makes up a large portion of the country’s tea trade. The following Harmonized System (HS) codes are useful for exporters, importers and customs professionals to identify tea products based on the method of processing and packaging.
1. HS Code 090240 – Black Tea in Bulk: Fermented black tea and partly fermented tea in packages of more than 3 kg. Kenyan CTC ( Crush , Tear , Curl ) black tea is widely used in tea bags , commercial blends , and mass beverage production.
2. HS Code 090230 – Black Tea in Retail Packages: It covers black tea and partially fermented tea in immediate packaging of 3 kg or less. This category includes a lot of packaged teas which are for supermarkets, retail shops and home consumption.
3. HS Code 090220 – Green Tea in Bulk: Unfermented green tea packed in packages > 3 kg. It caters to tea processors, wholesalers and producers of specialty blends and health drinks.
4. HS Code 090210 – Green Tea in Retail Packages: Green tea, unfermented, in immediate packings of a weight of not more than 3 kg. These products are generally intended to be ready for retail sale and distribution to consumers.
5. HS Code 090240 – Orthodox Black Tea: Orthodox tea is produced by traditional methods of rolling and processing. When it is black tea in packages greater than 3 kg, it may be under this heading; retail-sized packages may be under HS 090230 instead.
6. HS Code 090220 or 090210 – Specialty Green Tea: Specialty green teas are classified by package size . Bulk shipments are generally classified under HS 090220 and immediate packages of 3 kg or less are under HS 090210.
Kenya’s Tea Export Prices and Global Market Demand
Kenya’s tea export industry is of great importance in international agricultural trade, supplying black tea to major markets in Asia, Middle East, Europe and Africa. Export prices are influenced by the quality of the tea, auction results, production volumes, currency movements and demand from overseas buyers.
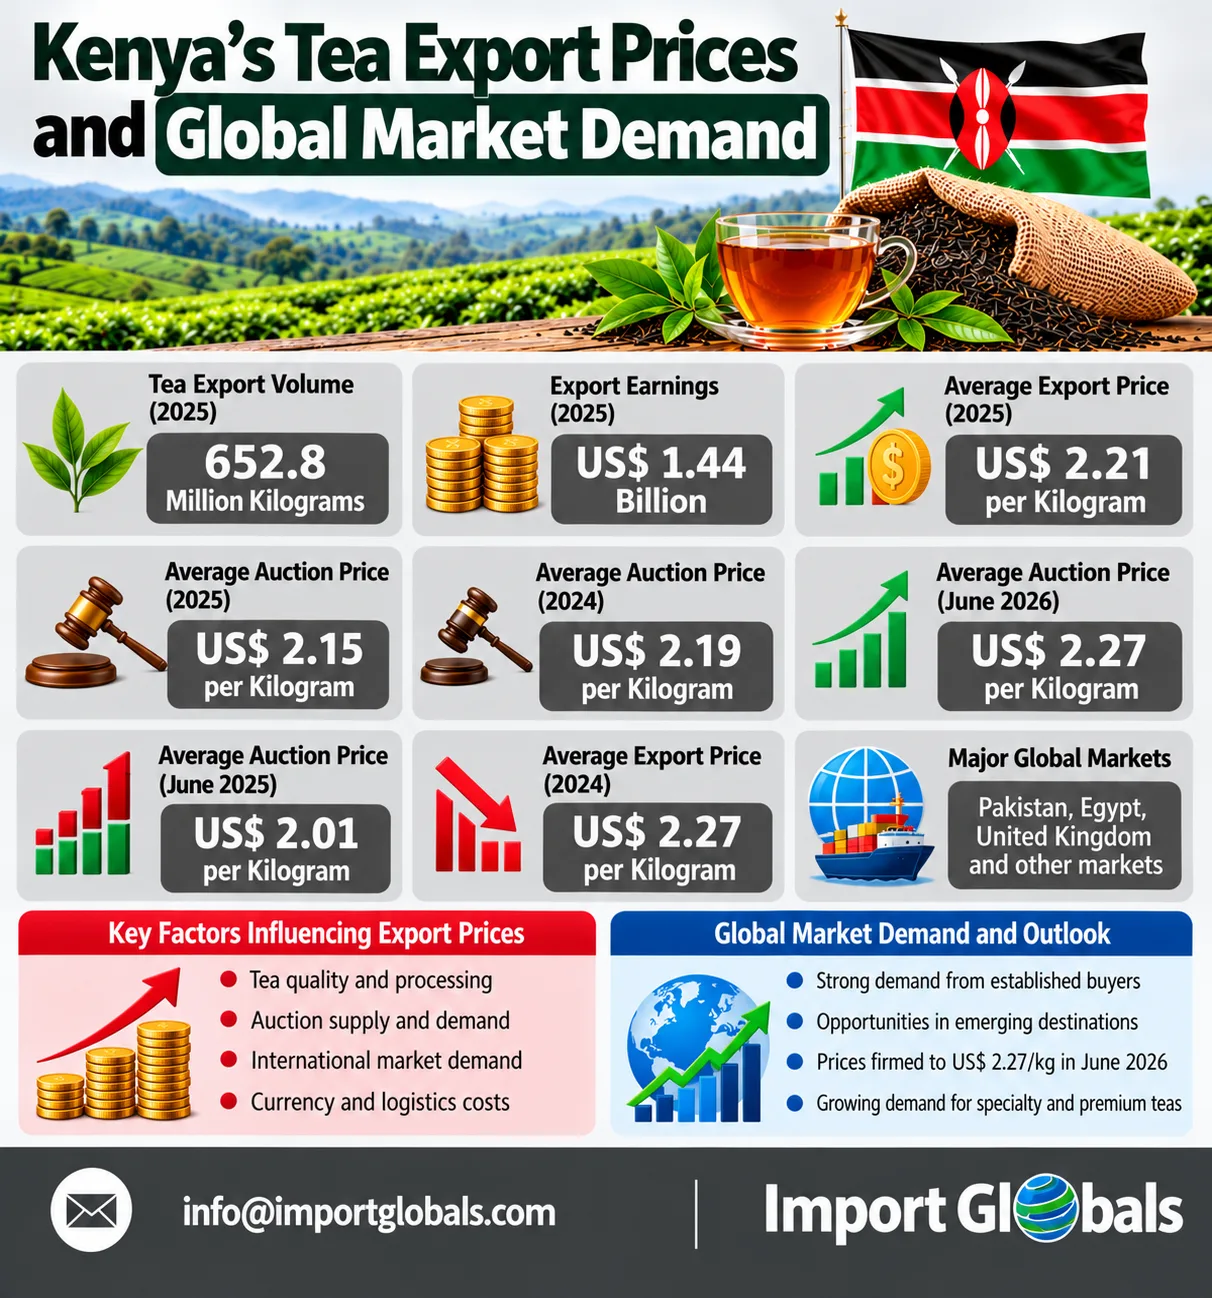
The Tea Board of Kenya says Kenya exported an estimated 652.8 million kilograms of tea in 2025, earning export earnings to the tune of about US$1.44 billion. The average unit price for exports was US$2.21 per kg, compared with US$2.27 in 2024. The average auction price meanwhile fell to just over US$2.15 a kilogram in 2025, from US$2.19 in 2024.
Major Factors Influencing Tea Export Prices
- Tea Quality and Processing: Depending on the buyer and the market conditions, premium orthodox teas and specialty varieties can fetch higher prices than regular bulk black tea.
- Auction Supply and Demand: More tea on the market tends to depress prices and less production and strong buying can support prices.
- International Market Demand: Established markets such as Pakistan, Egypt, United Kingdom and others influence Kenya’s export volumes and auction performance.
- Currency and Logistics Costs: Exporters’ margins and competitiveness are affected by exchange-rate fluctuations, freight charges, insurance and port handling expenses.
Leading Tea-Producing Regions and Export Companies in Kenya
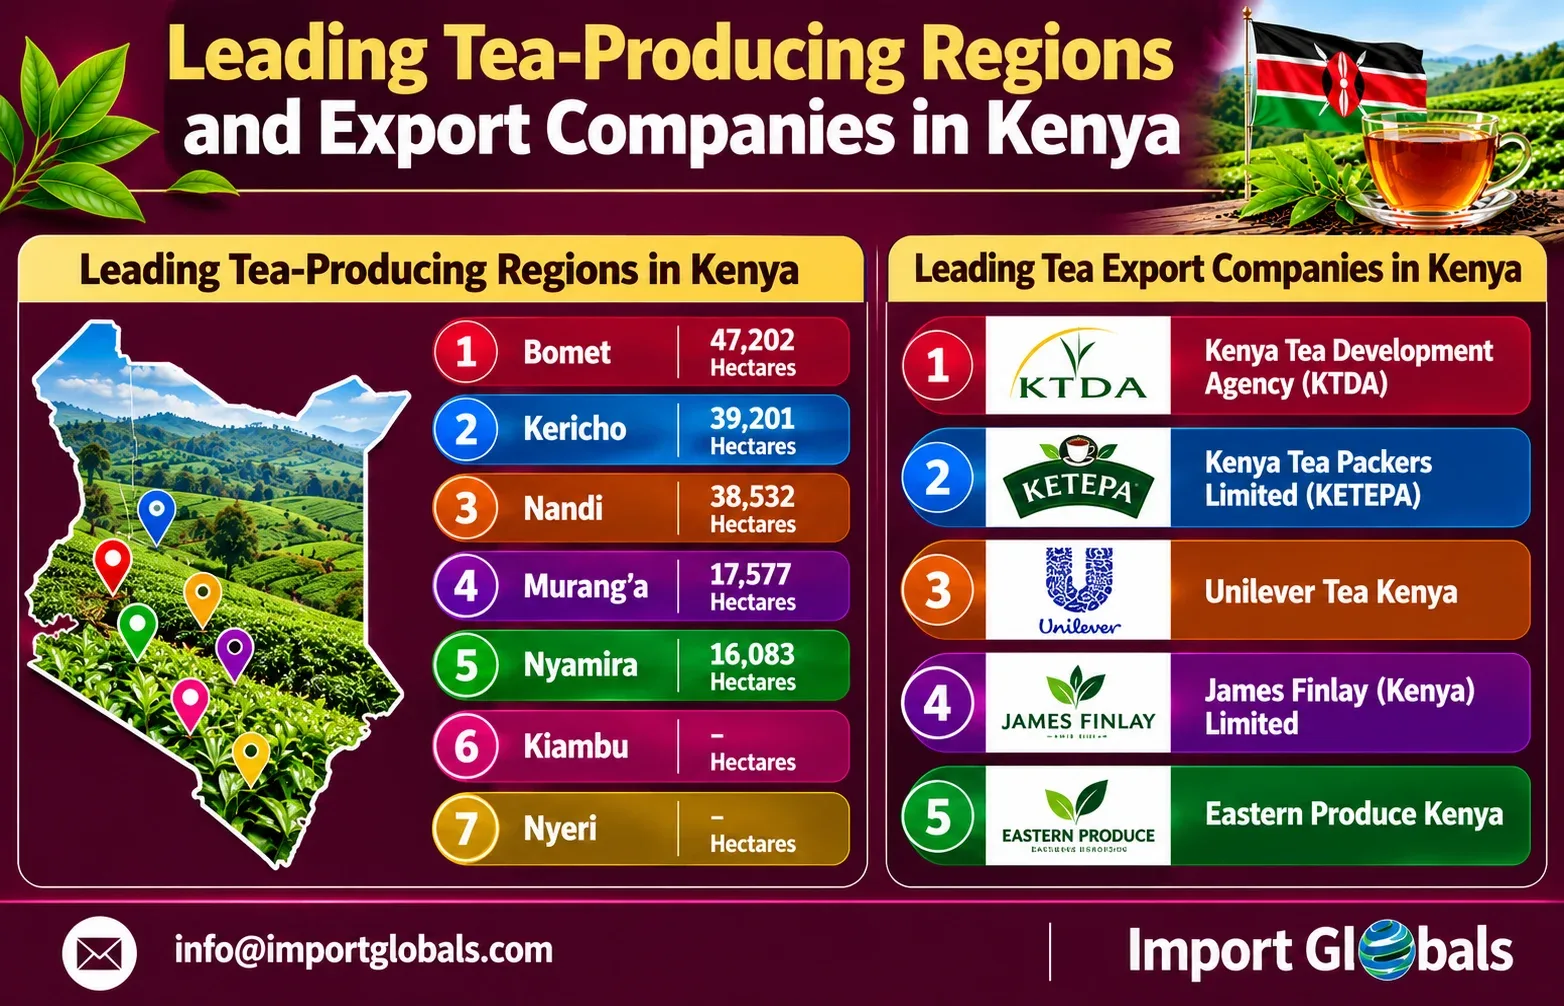
Tea is one of Kenya’s major agricultural export products, creating employment and generating foreign exchange earnings. Good quality tea is grown in the highlands on either side of the Great Rift Valley where good rainfall, fertile soils and cool temperatures are favorable for its growth. According to Kenya’s National Agriculture Production Report 2025, Kenya had some 228,414.7 hectares of land under tea cultivation in 2024. The main tea growing regions by area under cultivation were Bomet, Nandi and Kericho.
Leading Tea-Producing Regions
- Bomet: It recorded about 47,202 hectares under tea cultivation in 2024, the largest tea growing county by area in Kenya.
- Kericho: Had 39,201 hectares comprising tea estates, small holder farms and processing facilities.
- Nandi: It is recorded around 38,532 hectares and is known for its vast tea cultivation.
- Murang’a: An important eastern Rift tea-growing area with approximately 17,577 hectares under cultivation.
- Nyamira: Were about 16,083 hectares, and helped supply Kenya’s western highland tea.
- Kiambu and Nyeri: Both are established tea-growing areas of central Kenya supplying processors and the domestic and export markets.
Leading tea export companies in Kenya
1. Kenya Tea Development Agency (KTDA): Helps smallholders with factory management, tea processing, marketing and export coordination.
2. Kenya Tea Packers Limited (KETEPA): Blends and packages tea for retail and commercial markets.
3. Unilever Tea Kenya: Has been a longtime player in the country’s plantation tea sector.
4. James Finlay (Kenya) Limited: Works in tea growing, processing and international supply chains.
5. Eastern Produce Kenya: Emphasis on estate grown tea, processing & export oriented production.
Key Factors Driving Kenya’s Tea Export Growth in 2026

The country is a major exporter of tea, while tea is a foreign currency earner and employment generator. The industry has been experiencing good export performance at the beginning of 2026, which has followed its performance in 2025. It is reported that the Kenyan tea industry earned $1.44 billion through exports of tea worth 652.8 million kg in 2025.
1. Rising International Demand
Demand from traditional markets such as Pakistan, Egypt, the United Kingdom and the United Arab Emirates sustains Kenya’s tea exports. According to World Bank WITS data, Kenyan black tea exports under HS 090240 in 2025 reached approximately US$ 1.39 billion, with Pakistan being the main destination.
2. Expansion into New Export Markets
Kenya exporters are seeking new markets in Asia, Europe and Africa to cut dependence on a few buyers. Companies can use market expansion to find new customers and to lessen their exposure to changes in any one market.
3. Value Addition and Product Diversification
Packaged, blended and specialty teas under a brand name bring better returns than selling in bulk alone. Kenya has been on a policy direction of value addition with an ambition to increase the share of value added tea exports to 50 per cent by 2027.
4. Improved Production and Processing
Exporters will benefit from modernized factories, better processing technology, quality control and efficient supply chains to maintain consistency and meet international standards. Ongoing support for smallholder farmers is also a key to reliable supplies of tea.
5. Competitive Quality and Established Trade Networks
Kenya’s tradition of black tea, experienced exporters, auction infrastructure and international distribution networks help to maintain its position in global markets.
6. Data-Driven Export Decisions
By tracking prices, shipment volumes, buyer demand, freight costs, and trade regulations, businesses can respond to market changes. Import Globals is a trade intelligence service provider that enables businesses to research buyers, assess competitors and identify potential export opportunities by exploring Kenya Export Trade Statistics.
Challenges Affecting Kenya’s Tea Exports and International Competitiveness

In Kenya, tea export is a primary source of rural employment and foreign exchange earnings. However, Kenyan exporters and tea producers will face difficult conditions in 2026 due to rising production and operating costs of the product, geopolitical risks, volatility of prices and increased competition from other tea producing countries, although there will be an increase in tea exports in 2025.
1. Rising Production and Transportation Costs
Tea makers are feeling the squeeze on labor costs, fertilizers, electricity and factory overheads. Also the cost of exports increased due to cost of transportation, insurance and delivery, as disruptions in transport in the Red Sea and Middle East.
2. Fluctuating International Tea Prices
Prices at the Mombasa Tea Auction are based on supply, quality and international demand. The low prices obtained at auctions result in low profits for farmers and exporters, particularly in areas where production and transportation costs are relatively high. Kenya’s average export price per unit of tea declined to US$ 2.21 per kg from US$ 2.27 in 2024.
3. Dependence on Major Export Markets
The country is heavily dependent on few destinations like Pakistan, Egypt and United Kingdom which can have serious implications in case of political instability, currency pressure, trade embargos or drop in demand from these regions. In 2025, 81.5% of Kenya’s tea shipments were to 10 major destinations.
4. Geopolitical Conflicts and Shipping Disruptions
Delays can occur if there are conflicts in the Red Sea region or the Middle East that disrupt the usual shipping channels. In April 2026, industrial reports indicated that some 10 million kilogrammes of tea, worth an estimated KSh 3 billion, were stuck in the Mombasa warehouses owing to logistical challenges.
5. Increasing Competition from Regional Producers
Kenya is in competition with many other tea exporting countries. They include Uganda, Rwanda, Tanzania, India and Sri Lanka. Competitors may tempt consumers to switch suppliers with better prices, quality and lower delivery costs. Quality and competitiveness of products should be ensured.
6. Limited Value Addition and Branding
One such difficulty is that there is greater dependence on the export of bulk tea, than on high value added packaged and branded products. The blending, packaging and marketing of the tea outside Kenya means that less profit can be made from its sale at retail level.
7. Climate Change and Production Risks
Tea crop can be affected by unpredictable precipitation, drought, temperature and climatic conditions. There is need for climate resistant agriculture, suitable planting material and increased research assistance to ensure continuous production.
8. Regulatory and Market Access Barriers
Export tariffs, certification fees, customs and changing world quality standards can all inflate the costs of entering foreign markets. Competitiveness requires transparency and efficiency in regulation.
Global Trade Routes, Shipment Data and Kenya’s Tea Export Markets
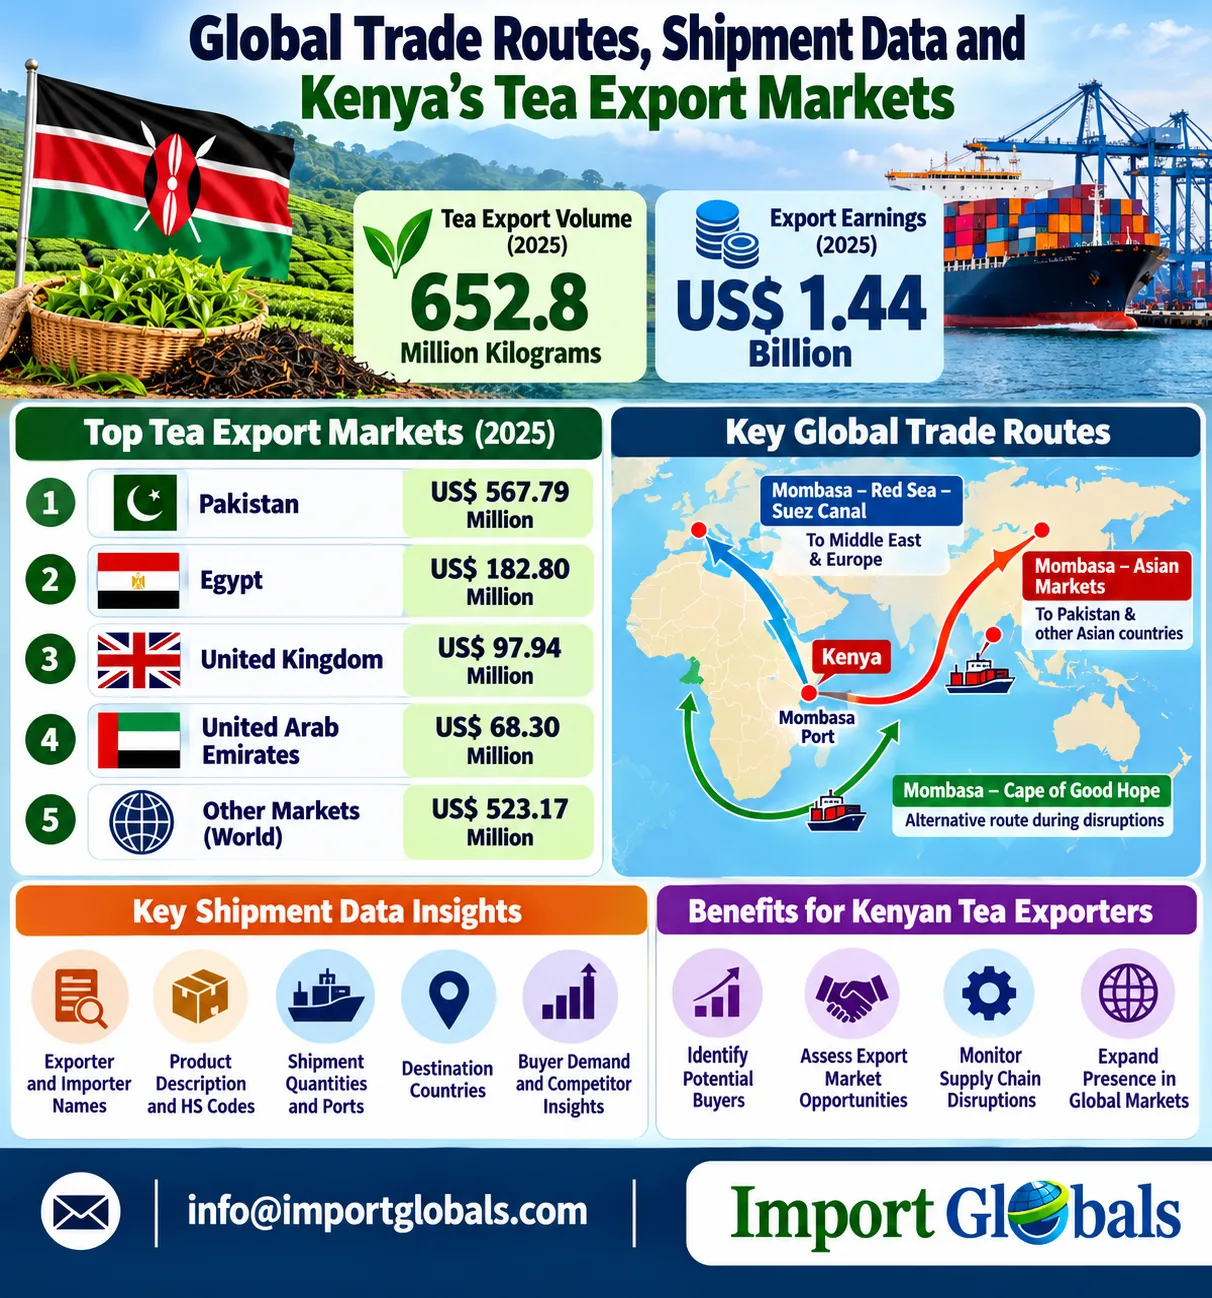
Kenya is among the top tea exporting nations and tea is exported through sea routes and global supply chains to international clients. In 2025, the exports from Kenya stood at around 652.8 million kilograms of tea, earning export revenues of $1.44 billion. Container ship movements enable the exporters to know their target market, shipping route and buyer requirements.
1. Major International Tea Export Markets
- Pakistan: It is one of the largest markets for Kenyan tea, importing black tea in HS 090240 worth US$567.79 million in 2025.
- Egypt: It is one of the major African and Middle East markets that has been receiving Kenyan black tea worth about US$182.80 million in 2025.
- United Kingdom: Kenya’s black tea exports to this major market in Europe were valued at US$97.94 million in 2025.
- United Arab Emirates: It links suppliers with buyers of goods in the Middle East region.
2. Key Global Trade Routes
- Mombasa–Red Sea–Suez Canal: Traditionally links Kenyan tea exports to the markets of the Middle East and Europe.
- Mombasa–Cape of Good Hope: A substitute when the Red Sea is disrupted and vessels have to go around southern Africa, which raises transit times and freight costs.
- Mombasa–Asian Markets: Maritime connections to Pakistan and other Asian destinations are possible depending on the routing arrangements and the schedule of the vessels.
3. Importance of Shipment Data
Shipment records include the names of the exporter and importer, a description of the product, HS codes, the quantities shipped, and the ports and destination countries. Businesses use this information to identify buyers, compare competitors, gage demand and track supply-chain disturbances.
4. How Import Globals Supports Trade Research
Import Globals is a trade intelligence service provider that helps businesses explore Kenya Export Trade Statistics to research international trade flows, identify potential buyers and evaluate export market opportunities.
Future Outlook for Kenya’s Tea Exports: Emerging Buyers and Business Opportunities
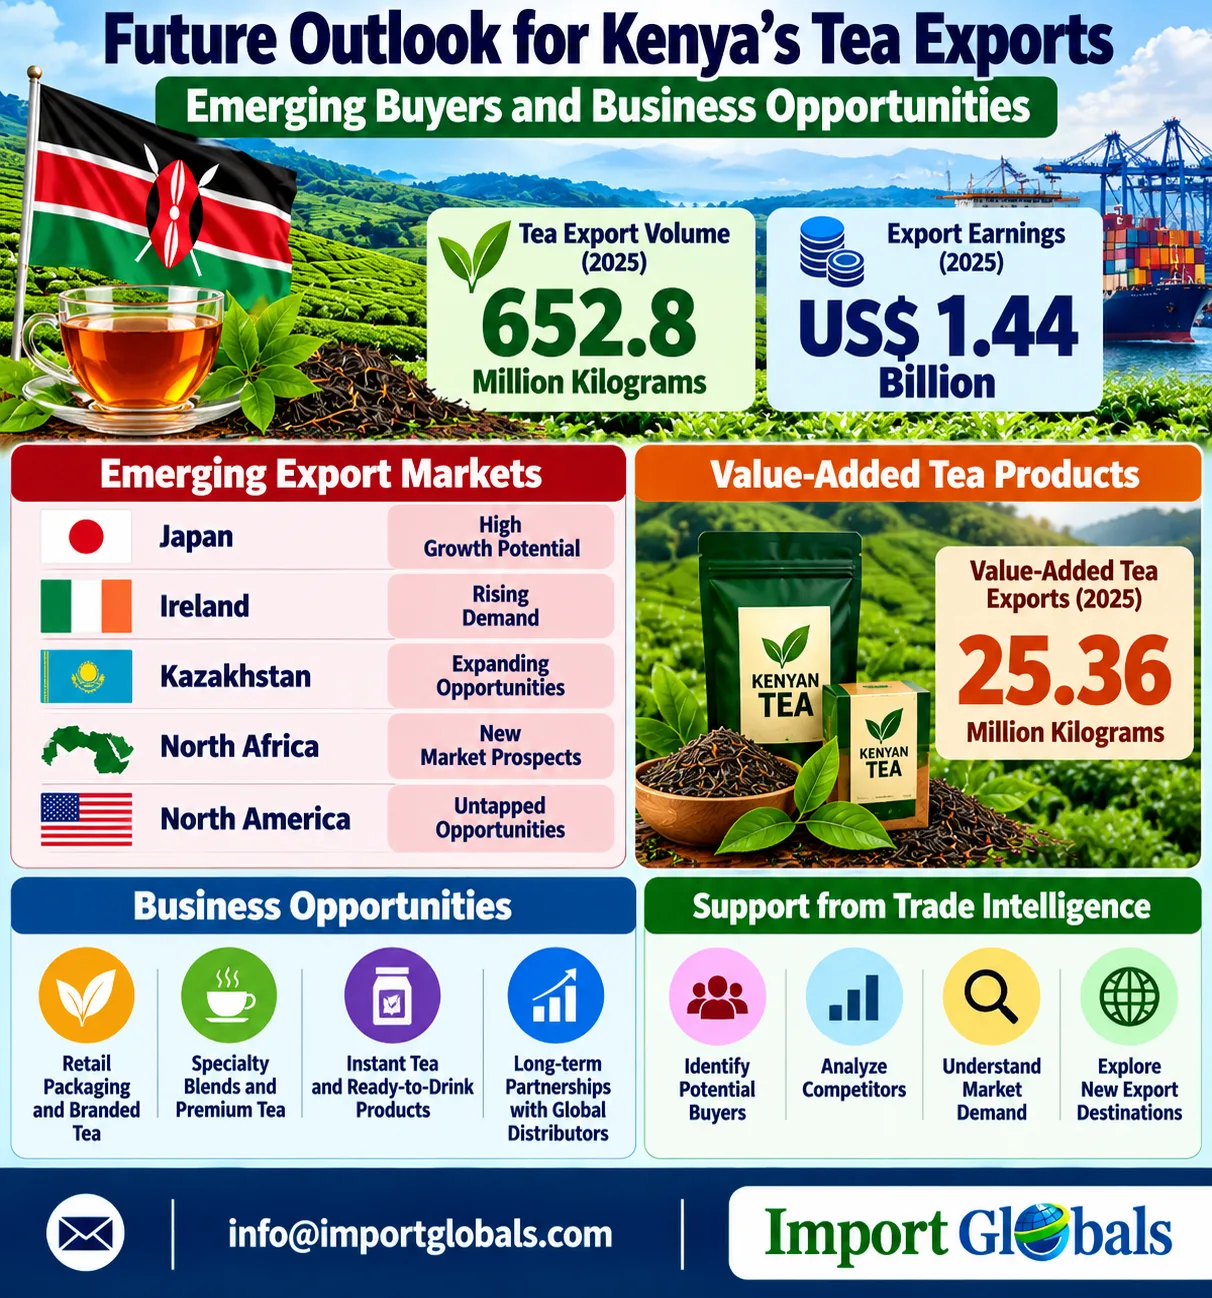
Kenya’s tea exports have many prospects for growth in 2026 considering variables including higher global demand for the product, market diversification and investments in value-added products. In 2025, Kenya exported some 652.8 million kgs of tea earning the country about US$1.44 billion in export earnings. The product was sold to 100 markets around the globe.
Key Emerging Markets and Business Opportunities
- North Africa and North America: The move is aimed at expanding market reach for the purpose of diversifying export destinations.
- Japan, Ireland, and Kazakhstan: The emerging destinations recorded strong growth in tea exports along with more opportunities for market expansion.
- Value-Added tea Products: There was room for Kenyan companies to improve utilization through local value addition activities such as retail packaging, brand marketing and specialty blends. Exports of value added tea in 2025 amounted to around 25.36 million kg.
- Digital Trade Intelligence: These shipping statistics and buyer analysis are useful to exporters in finding new customers, analyzing their competitors and also in evaluating changing needs of customers.
Conslusion
Kenya’s tea exports are set for strong international trade in 2026, buoyed by robust demand, established buyers and new market destinations. The key markets are Pakistan and Egypt, the UK and UAE with new markets also offering further growth opportunities. Kenya’s global competitiveness can be boosted by value addition, improved processing, sustainable production and efficient shipping. Kenya Export Data, Kenya Import Data, Kenya Trade Data and Kenya Customs Data can assist the business to find buyers, analyze the shipment trends and explore new markets. Import Globals gives companies trade intelligence to make smart sourcing and export decisions.
CTA
Find out about Kenya’s Tea Export Opportunities with Import Globals! Kenya Export Trade Data to identify international customers, analyze shipment trends and identify new markets. To improve your sourcing strategy, grow your customer base and make smart global trade decisions, visit www.importglobals.com or email info@importglobals.com.
FAQs
Que. What is the export value of Kenya tea in 2025?
Ans. Kenya earned US$1.44 billion in export earnings from tea exports in 2025.
Que. Which country buys the most tea from Kenya?
Ans. Pakistan is the largest importer of Kenyan black tea, importing around US$567.79 million in 2025.
Que. What are the other buyers of Kenyan tea?
Ans. Egypt, UK, Kazakhstan, UAE, Iran, Russia, Oman.
Que. What are the main types of tea that Kenya exports?
Ans. Black tea including CTC and Orthodox, green tea and processed products are the main exports of Kenya.
Que. Kenya’s black tea exports fall under the main HS code 090620.
Ans. HS code 090240 represents black tea packed in packages weighing more than 3 kg, while HS 090230 represents black tea packed in packages weighing 3 kg or less.
Que. What are the emerging markets that Kenya can tap in the year 2026?
Ans. Some of the emerging markets are North America, North Africa, Kazakhstan, Ireland and so forth.
Que. What is the impact on the price of Kenyan tea exports?
Ans. Price depends on the quality of tea, auction prices, demand for tea, weather conditions, cost of production, currency rates and cost of freight charges.
Que. How does Kenya’s tea export business impact the economy?
Ans. Tea exports contribute in foreign exchange earnings, employment generation and income generation.
Que. The main tea exporting countries in the world are:
Ans. China, Kenya, Sri Lanka, India and Vietnam are the main tea exporting countries.
Que. How frequently is the Kenya Tea Export Data updated?
Ans. Kenya Tea Export Data is updated on a monthly basis.
Que. Where can businesses obtain Kenya tea trade intelligence?
Ans. Visit www.importglobals.com or email info@importglobals.com to explore global trade intelligence services.
You Can Also Visit :-
